• About
  • Elliott Waves
    • Elliott Waves Explained
    • Elliott Wave Magic Illustrated with Wave Charts
    • Elliott Wave Edge – How Elliott Wave Traders Win
    • Fibonacci Number Series and Elliott Waves
    • How to use Fibonacci Ratio Retracements
    • Elliott Wave Books
      • The Elliott Wave Book – Five Waves to Financial Freedom
      • Dividend Growth Investing Using Elliott Waves
    • Videos
  • Equities
    • Indices
      • Africa
        • Egypt
      • Australia
      • European Indices
        • AEX – Index, Amsterdam
        • DAX Index
        • Istanbul
        • Russia
        • Spain’s IBEX 35
      • Asian Indices
        • India
        • China
        • Dubai
        • Kuwait
        • Kuala Lumpur
        • Pakistan
        • Saudi
        • Taiwan
      • US Indices
        • S&P500
        • Nasdaq
        • Dow Jones
        • Dow Jones Utilities
    • Stocks
      • Asian Stocks
        • Indian Stocks Trading
        • Dubai Stocks Outlook
        • Japanese Stocks
        • Kuwait stocks
        • Saudi Stocks Outlook
      • African Stocks
        • Egyptian Stocks
      • Swiss Stocks
      • Australian Stocks
      • European Stocks
      • US Stocks outlook
      • UK Stocks
  • Commodities
    • Copper
    • Gasoline
    • Gold
    • Natural Gas
    • Oil
    • Palm Oil
    • Raw Sugar
    • Rubber
    • Soybean Oil
    • Silver
  • Forex
    • AUD
    • Bitcoin
    • CAD
    • CHF
    • Euro
    • GBP
    • INR
    • NZD
    • JPY
  • Raves
  • Consulting
    • Consulting
  • Ramki’s Watchlist
Top News

Has Meta (Facebook) stock seen the bottom

March 21, 2022

What Is The Nearest Technical Support For Meta (NASDAQ: FB)

February 7, 2022

Using Elliott Waves to Capture a Trade in S&P500

January 27, 2022
Facebook Twitter Instagram
WaveTimes Blog WaveTimes Blog
Wave times
  • About
  • Elliott Waves
    • Elliott Waves Explained
    • Elliott Wave Magic Illustrated with Wave Charts
    • Elliott Wave Edge – How Elliott Wave Traders Win
    • Fibonacci Number Series and Elliott Waves
    • How to use Fibonacci Ratio Retracements
    • Elliott Wave Books
      • The Elliott Wave Book – Five Waves to Financial Freedom
      • Dividend Growth Investing Using Elliott Waves
    • Videos
  • Equities
    • Indices
      • Africa
        • Egypt
      • Australia
      • European Indices
        • AEX – Index, Amsterdam
        • DAX Index
        • Istanbul
        • Russia
        • Spain’s IBEX 35
      • Asian Indices
        • India
        • China
        • Dubai
        • Kuwait
        • Kuala Lumpur
        • Pakistan
        • Saudi
        • Taiwan
      • US Indices
        • S&P500
        • Nasdaq
        • Dow Jones
        • Dow Jones Utilities
    • Stocks
      • Asian Stocks
        • Indian Stocks Trading
        • Dubai Stocks Outlook
        • Japanese Stocks
        • Kuwait stocks
        • Saudi Stocks Outlook
      • African Stocks
        • Egyptian Stocks
      • Swiss Stocks
      • Australian Stocks
      • European Stocks
      • US Stocks outlook
      • UK Stocks
  • Commodities
    • Copper
    • Gasoline
    • Gold
    • Natural Gas
    • Oil
    • Palm Oil
    • Raw Sugar
    • Rubber
    • Soybean Oil
    • Silver
  • Forex
    • AUD
    • Bitcoin
    • CAD
    • CHF
    • Euro
    • GBP
    • INR
    • NZD
    • JPY
  • Raves
  • Consulting
    • Consulting
  • Ramki’s Watchlist
WaveTimes Blog WaveTimes Blog
Home » Elliott Wave Analysis of Shanghai Stock Index
China

Elliott Wave Analysis of Shanghai Stock Index

RamkiBy RamkiMarch 18, 20129 Comments4 Mins Read
Facebook Twitter LinkedIn Telegram Pinterest Tumblr Reddit WhatsApp Email
Share
Facebook Twitter LinkedIn Pinterest Email

In order to be successful in our investment activity, we should spend the required time to analyze the stock/index/commodity etc that we want to invest in. Once you identify what you are interested in, the next thing to do is to figure out what is a good price to get involved. Elliott Wave analysis will help you here to some extent. Take the Shanghai Stock Index for example. If you had spotted that a five wave rally had finished at 6124, will you be willing to buy the next dip? Probably not. You will have side stepped the entire sell off to 1664. After that, when the markets started to recover, you might have been tempted to trade the minor waves because your stops would have been affordable. Once again, when a five wave rally finished at 3478 in August 2009, you would have no longer been interested in buying until a correction was posted. But now things get more interesting. Are we in the threshold of a huge third wave? Perhaps yes, but who knows! THe best we can do is to wait for that sweet spot where buying makes sense. Now take a look at the first chart and read on.
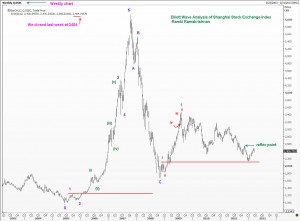
In my book “Five Waves to Financial Freedom” I have explained that if wave 2 is a zigzag, the maximum distance it can travel is usually limited to the top of wave 1 of the lower degree. Clearly the ABC correction from 6124 finished well ahead of the top of wave 1. The new rally from the point C can (for now) be considered the start of the next leg of the cycle. This is why I have labeled that wave up to 3478 as wave 1 (Green color). The ensuing correction is a double zigzag, and till now it has stayed above the top of wave 1 of lower degree (see red horizontal line). If we now get a move above the reflex point in five waves, then we can be more conifdent of buying (in stages) from a 50% correction because any subsequent rally will be a third wave in the progression.This is ‘how’ we should really be using Elliott Waves. To plan ahead, and be aware of when the odds shift in our favor. The right plan and an ample supply of patience to wait for those sweet spots will reward you handsomely.

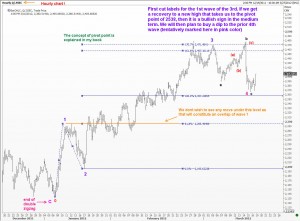
The next chart zooms a bit closer to look at the hourly charts. Once again, we attempt to label the waves. Remember that what I have shown are all tentative labels. There are so many ways one could label these waves that trying out every possible combination is a worthless endeavor. We should look at the chart and decide on one count that we like best. Then we should stick with it until proved wrong. This is the key. REMEMBER THAT NO ONE (repeat NO ONE) CAN EVER BE SURE ABOUT A WAVE COUNT UNTIL THE MOVE IS OVER. So what is the point of having labels? It is to help us have a plan to trade. If we are proved wrong, we get out! Simple as that.
Shanghai Stock Index
(Thus, when I showed in my Forbes article that S&P500 could be approaching a significant top between 1435/1475, that is a work-in-progress. If anyone tells you that they KNOW already that some other count is what is correct, he/she is not sharing the real truth. We can only make judgement calls, and we will always have to bear in mind that the market is the master, and it will do whatever it wants irrespective of what fancy counts Ramki or anyone else can publish in a humble blog such as WaveTimes. By the way, just because I published it in Forbes does not make me any cleverer) Having understood the spirit of what I am trying to convey, take a look at the second chart and see if you can relate it to what you have read elsewhere in this blog, and maybe in my book “Five Waves to Financial Freedom”. Best wishes. Ramki

China Shanghai Stock Index SSEC
Share. Facebook Twitter Pinterest LinkedIn Tumblr Telegram Email
Previous ArticleElliott Wave Analysis of Dow Jones Utility Average (DJU)
Next Article How to trade Apple in light of the dividend news?
Ramki
  • Website

Related Posts

Shanghai Stock Index Update

March 28, 2012

SSE Composite Index: Elliott Wave Analysis

January 5, 2012

Elliott Wave Analysis of Shanghai SE Composite Index Nov 2011

October 30, 2011
View 9 Comments

9 Comments

  1. PatternSolver on March 18, 2012 6:00 am

    Dear Ramki,

    Once again a very nicely done projection on the S&P500.

    I had posted a comment on 26th Jan here stating…..

    ” If 1376 is indeed achieved and if it results only in a partial correction(protecting 1265) , is there any wave which could indicate on the Elliot wave study perspective which could take it to new highs towards 1510 ? or it would be known only when the price movements come closer towards 1376 or 1265 ? “……….

    It was again very well answered by you in your response and you made a good point in this posting too.

    Reply
    • Ramki on March 18, 2012 6:31 am

      Hi Patternsolver, thanks for the comments

      Reply
  2. Yan on March 18, 2012 7:53 am

    Hi Sir, many thanks for the update on Shanghai Index.

    here is the hourly wave count I did yesterday: http://screencast.com/t/nqtXm1q0wjsX
    slightly different wave structure as to yours, but I do agree on the recent zigzag abc move as a possible 4th wave, its just I think it looks like a 4th wave in one less degree to the one on your chart.

    and I got 2571 marked off as major resistance on the weekly chart, where we could see a correction cycle begin. here is revised weekly wave count: http://screencast.com/t/dqOJeacy where Y=80.9% of W measure from X
    80.9% is a fib level this market does react to from time to time.

    I have also noticed that on your hourly chart you have used 170.7% fib level which I can’t remember was mentioned in your book. do we need to pay attention to this level or will you be covering it in the 2nd book?

    Yan

    Reply
    • Ramki on March 19, 2012 6:34 am

      Hello Yan,
      The 170.7% fib level is something that I use every now and then. I also use 361.8% which is not a fibonacci number. I didn;t include these in the book because there is no point giving too much details and confusing the reader. FWTFF is a good place to start your research on Elliott Waves. The main goal is to take away your fear of ELliott Waves!

      Reply
  3. Yan on March 28, 2012 5:11 am

    SHanghai Index closed at 2284 today, which has invalided this wave count.

    Reply
    • Ramki on March 28, 2012 5:23 am

      Hi Yan, Absolutely. As discussed in teh article, it was all very tentative because we didnt get a move to the pivot point. Now that it borke below the top of wave 1, we stay away.

      Reply
  4. BJ on September 7, 2012 3:19 am

    Hi Ramki,

    Have you had a look at Shanghai composite today? I could see a clear 5 wave decline from 2453 to 2029 that ended with a +ve divergence and has blasted off 3.7% today. Do we watch for 2176 as the reflex point here? Was it the end of wave 5 of 3 of a Big C or was it 5 of 5 of Big C. I understand any count is possible but what are your thoughts especially given that this has overlapped the initial move off the 2008 low (on weekly charts). Can you do a post for us here?

    Thanks in advance,
    BJ

    Reply
  5. Pingback: Elliott Wave Analysis and Reflex Point as an important clue

  6. Pingback: Elliott Wave Analysis and Reflex Point as an important clue

Leave A Reply Cancel Reply

Recent Posts
  • Has Meta (Facebook) stock seen the bottom
  • What Is The Nearest Technical Support For Meta (NASDAQ: FB)
  • Using Elliott Waves to Capture a Trade in S&P500
  • Hedge Funds and Elliott Waves – Netflix $NFLX
  • When Elliott Waves applauds the promoter’s signals!

WaveTimes is a Research Organization dedicated to providing original analysis, reports, reviews, and insights on developments in mutual funds, stocks, investing, foreign exchange, commodities, and bonds.

Contact WaveTimes

L-601 Mantri Espana,

Kariyammana Agrahara, Bellandur, Bangalore 560103

Follow Us

  • Facebook
  • YouTube
  • Twitter

© 2023 Wave Times. All Rights Reserved.
  • About
  • Books
  • Privacy Policy
  • Policies and Standards

Type above and press Enter to search. Press Esc to cancel.