• About
  • Elliott Waves
    • Elliott Waves Explained
    • Elliott Wave Magic Illustrated with Wave Charts
    • Elliott Wave Edge – How Elliott Wave Traders Win
    • Fibonacci Number Series and Elliott Waves
    • How to use Fibonacci Ratio Retracements
    • Elliott Wave Books
      • The Elliott Wave Book – Five Waves to Financial Freedom
      • Dividend Growth Investing Using Elliott Waves
    • Videos
  • Equities
    • Indices
      • Africa
        • Egypt
      • Australia
      • European Indices
        • AEX – Index, Amsterdam
        • DAX Index
        • Istanbul
        • Russia
        • Spain’s IBEX 35
      • Asian Indices
        • India
        • China
        • Dubai
        • Kuwait
        • Kuala Lumpur
        • Pakistan
        • Saudi
        • Taiwan
      • US Indices
        • S&P500
        • Nasdaq
        • Dow Jones
        • Dow Jones Utilities
    • Stocks
      • Asian Stocks
        • Indian Stocks Trading
        • Dubai Stocks Outlook
        • Japanese Stocks
        • Kuwait stocks
        • Saudi Stocks Outlook
      • African Stocks
        • Egyptian Stocks
      • Swiss Stocks
      • Australian Stocks
      • European Stocks
      • US Stocks outlook
      • UK Stocks
  • Commodities
    • Copper
    • Gasoline
    • Gold
    • Natural Gas
    • Oil
    • Palm Oil
    • Raw Sugar
    • Rubber
    • Soybean Oil
    • Silver
  • Forex
    • AUD
    • Bitcoin
    • CAD
    • CHF
    • Euro
    • GBP
    • INR
    • NZD
    • JPY
  • Raves
  • Consulting
    • Consulting
  • Ramki’s Watchlist
Top News

Has Meta (Facebook) stock seen the bottom

March 21, 2022

What Is The Nearest Technical Support For Meta (NASDAQ: FB)

February 7, 2022

Using Elliott Waves to Capture a Trade in S&P500

January 27, 2022
Facebook Twitter Instagram
WaveTimes Blog WaveTimes Blog
Wave times
  • About
  • Elliott Waves
    • Elliott Waves Explained
    • Elliott Wave Magic Illustrated with Wave Charts
    • Elliott Wave Edge – How Elliott Wave Traders Win
    • Fibonacci Number Series and Elliott Waves
    • How to use Fibonacci Ratio Retracements
    • Elliott Wave Books
      • The Elliott Wave Book – Five Waves to Financial Freedom
      • Dividend Growth Investing Using Elliott Waves
    • Videos
  • Equities
    • Indices
      • Africa
        • Egypt
      • Australia
      • European Indices
        • AEX – Index, Amsterdam
        • DAX Index
        • Istanbul
        • Russia
        • Spain’s IBEX 35
      • Asian Indices
        • India
        • China
        • Dubai
        • Kuwait
        • Kuala Lumpur
        • Pakistan
        • Saudi
        • Taiwan
      • US Indices
        • S&P500
        • Nasdaq
        • Dow Jones
        • Dow Jones Utilities
    • Stocks
      • Asian Stocks
        • Indian Stocks Trading
        • Dubai Stocks Outlook
        • Japanese Stocks
        • Kuwait stocks
        • Saudi Stocks Outlook
      • African Stocks
        • Egyptian Stocks
      • Swiss Stocks
      • Australian Stocks
      • European Stocks
      • US Stocks outlook
      • UK Stocks
  • Commodities
    • Copper
    • Gasoline
    • Gold
    • Natural Gas
    • Oil
    • Palm Oil
    • Raw Sugar
    • Rubber
    • Soybean Oil
    • Silver
  • Forex
    • AUD
    • Bitcoin
    • CAD
    • CHF
    • Euro
    • GBP
    • INR
    • NZD
    • JPY
  • Raves
  • Consulting
    • Consulting
  • Ramki’s Watchlist
WaveTimes Blog WaveTimes Blog
Home » Elliott Wave Analysis of Shanghai SE Composite Index Nov 2011
China

Elliott Wave Analysis of Shanghai SE Composite Index Nov 2011

RamkiBy RamkiOctober 30, 20118 Comments1 Min Read
Facebook Twitter LinkedIn Telegram Pinterest Tumblr Reddit WhatsApp Email
Share
Facebook Twitter LinkedIn Pinterest Email

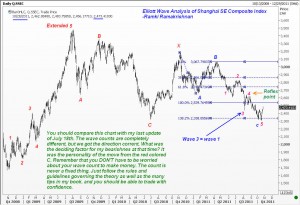
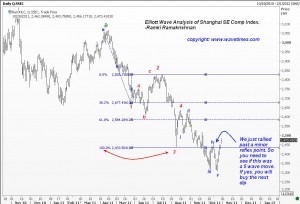
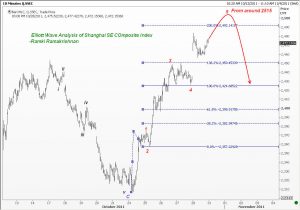
It is three months since I presented some Elliott Wave Analysis of the Shanghai SE Composite Index.. There are several requests for an update and so here are the relevant charts with Elliott Wave comments.

You should compare the first chart with my last update of July 18th. The wave counts are completely different, but we got the direction correct. What was the deciding factor for my bearishnes at that time? It was the personality of the move from the red colored C. Remember that you DON’T have to be worried about your wave count to make money. The count is never a fixed thing. Just follow the rules and guidelines governing the theory (and if you wish, the many tips in my book, Five Waves to Financial Freedom, and you should be able to trade with confidence

China Shanghai Composite Index
Share. Facebook Twitter Pinterest LinkedIn Tumblr Telegram Email
Previous ArticleNSEI update 30 Oct 2011
Next Article Elliott Wave Update on EURUSD 2 Nov 2011
Ramki
  • Website

Related Posts

Shanghai Stock Index Update

March 28, 2012

Elliott Wave Analysis of Shanghai Stock Index

March 18, 2012

SSE Composite Index: Elliott Wave Analysis

January 5, 2012
View 8 Comments

8 Comments

  1. Steve Osborne on October 31, 2011 5:11 pm

    I agree with your Shanghai Nov11 chart. I think that the recent rise in stock prices were a deviation from the a bull market that started in July-August.

    Reply
  2. alex on November 1, 2011 5:27 am

    hi Ramki. i have some question to ask you , wave four price within the limits of wave one price,is it accord with wave rules,
    the technical analysis show me i should buy ,but i don’t see fundamental plane support the china stock arise higher, i am very suffering, i am now short position since april.

    Reply
    • Ramki on November 1, 2011 11:53 pm

      Hi Alex, I am sorry to hear you are suffering with some bad trades. If Wave four comes into the territory of wave 1 during an IMPULSE phase, that violates one of the rules, and you would assume that we are only in a correction. Regarding your other comment, where the fundamentals and technicals appear to show you different paths, there is no single answer. If you are trading with the help of charts, you should know where to have a stop loss.

      Reply
  3. prithvi on November 1, 2011 11:58 pm

    Dear Ramki,
    As per your instruction for drawn your attention about crude price,
    Now the price comes @94,Now Please update ur post for that.
    and please update about about dow.

    Reply
    • Ramki on November 2, 2011 12:03 am

      Prithvi, Thanks for that, but please post your comment under Oil..not under Shanghai Index!

      Reply
  4. Yan on December 15, 2011 10:59 am

    My Teacher, The Chinese Index has just broken 2200 mark yesterday. obviously my bullish wave count was incorrect. the chart looks horrible now, how much lower do you think it will go please. I am in cash atm, so I am not nervous.

    Many Thanks

    Reply
  5. Steve Osborne on December 15, 2011 6:24 pm

    Correction from my Oct. 31 post above:
    I meant “the bear market that started in July-August” (otherwise my post doesn’t make sense). Since then (since Oct 31st), the market went up with good technicals; then went down during a barrage of events such as the Supercommittee’s deadline; and back up up after that. In November, markets tested the 11500 bar defining the level above which we have a bull market and below which we have a bear market. Last week, markets revisited the 12200 resistance level and retreated in what could be a step back to jump higher.

    Reply
  6. Yan on December 15, 2011 6:57 pm

    Sir, I think I might have answered my own question again.

    this is the revised wave count on the weekly time frame. it is a extended 3rd wave, and the 3rd wave will end at 2060–2075. (2.618 of wave 1), then retrace 23.6% of wave 3 make a new low afterwards, because the 2nd wave was deep and irregular, hence the 4th wave should be shallow?

    http://screencast.com/t/SVELeJMStQwd

    Reply

Leave A Reply Cancel Reply

Recent Posts
  • Has Meta (Facebook) stock seen the bottom
  • What Is The Nearest Technical Support For Meta (NASDAQ: FB)
  • Using Elliott Waves to Capture a Trade in S&P500
  • Hedge Funds and Elliott Waves – Netflix $NFLX
  • When Elliott Waves applauds the promoter’s signals!

WaveTimes is a Research Organization dedicated to providing original analysis, reports, reviews, and insights on developments in mutual funds, stocks, investing, foreign exchange, commodities, and bonds.

Contact WaveTimes

L-601 Mantri Espana,

Kariyammana Agrahara, Bellandur, Bangalore 560103

Follow Us

  • Facebook
  • YouTube
  • Twitter

© 2023 Wave Times. All Rights Reserved.
  • About
  • Books
  • Privacy Policy
  • Policies and Standards

Type above and press Enter to search. Press Esc to cancel.