• About
  • Elliott Waves
    • Elliott Waves Explained
    • Elliott Wave Magic Illustrated with Wave Charts
    • Elliott Wave Edge – How Elliott Wave Traders Win
    • Fibonacci Number Series and Elliott Waves
    • How to use Fibonacci Ratio Retracements
    • Elliott Wave Books
      • The Elliott Wave Book – Five Waves to Financial Freedom
      • Dividend Growth Investing Using Elliott Waves
    • Videos
  • Equities
    • Indices
      • Africa
        • Egypt
      • Australia
      • European Indices
        • AEX – Index, Amsterdam
        • DAX Index
        • Istanbul
        • Russia
        • Spain’s IBEX 35
      • Asian Indices
        • India
        • China
        • Dubai
        • Kuwait
        • Kuala Lumpur
        • Pakistan
        • Saudi
        • Taiwan
      • US Indices
        • S&P500
        • Nasdaq
        • Dow Jones
        • Dow Jones Utilities
    • Stocks
      • Asian Stocks
        • Indian Stocks Trading
        • Dubai Stocks Outlook
        • Japanese Stocks
        • Kuwait stocks
        • Saudi Stocks Outlook
      • African Stocks
        • Egyptian Stocks
      • Swiss Stocks
      • Australian Stocks
      • European Stocks
      • US Stocks outlook
      • UK Stocks
  • Commodities
    • Copper
    • Gasoline
    • Gold
    • Natural Gas
    • Oil
    • Palm Oil
    • Raw Sugar
    • Rubber
    • Soybean Oil
    • Silver
  • Forex
    • AUD
    • Bitcoin
    • CAD
    • CHF
    • Euro
    • GBP
    • INR
    • NZD
    • JPY
  • Raves
  • Consulting
    • Consulting
  • Ramki’s Watchlist
Top News

Has Meta (Facebook) stock seen the bottom

March 21, 2022

What Is The Nearest Technical Support For Meta (NASDAQ: FB)

February 7, 2022

Using Elliott Waves to Capture a Trade in S&P500

January 27, 2022
Facebook Twitter Instagram
WaveTimes Blog WaveTimes Blog
Wave times
  • About
  • Elliott Waves
    • Elliott Waves Explained
    • Elliott Wave Magic Illustrated with Wave Charts
    • Elliott Wave Edge – How Elliott Wave Traders Win
    • Fibonacci Number Series and Elliott Waves
    • How to use Fibonacci Ratio Retracements
    • Elliott Wave Books
      • The Elliott Wave Book – Five Waves to Financial Freedom
      • Dividend Growth Investing Using Elliott Waves
    • Videos
  • Equities
    • Indices
      • Africa
        • Egypt
      • Australia
      • European Indices
        • AEX – Index, Amsterdam
        • DAX Index
        • Istanbul
        • Russia
        • Spain’s IBEX 35
      • Asian Indices
        • India
        • China
        • Dubai
        • Kuwait
        • Kuala Lumpur
        • Pakistan
        • Saudi
        • Taiwan
      • US Indices
        • S&P500
        • Nasdaq
        • Dow Jones
        • Dow Jones Utilities
    • Stocks
      • Asian Stocks
        • Indian Stocks Trading
        • Dubai Stocks Outlook
        • Japanese Stocks
        • Kuwait stocks
        • Saudi Stocks Outlook
      • African Stocks
        • Egyptian Stocks
      • Swiss Stocks
      • Australian Stocks
      • European Stocks
      • US Stocks outlook
      • UK Stocks
  • Commodities
    • Copper
    • Gasoline
    • Gold
    • Natural Gas
    • Oil
    • Palm Oil
    • Raw Sugar
    • Rubber
    • Soybean Oil
    • Silver
  • Forex
    • AUD
    • Bitcoin
    • CAD
    • CHF
    • Euro
    • GBP
    • INR
    • NZD
    • JPY
  • Raves
  • Consulting
    • Consulting
  • Ramki’s Watchlist
WaveTimes Blog WaveTimes Blog
Home » Elliott Wave Analysis of Saudi Arabia's TASI Index
Saudi

Elliott Wave Analysis of Saudi Arabia's TASI Index

RamkiBy RamkiFebruary 12, 201243 Comments1 Min Read
Facebook Twitter LinkedIn Telegram Pinterest Tumblr Reddit WhatsApp Email
Share
Facebook Twitter LinkedIn Pinterest Email

Saudi Arabia's TASI index
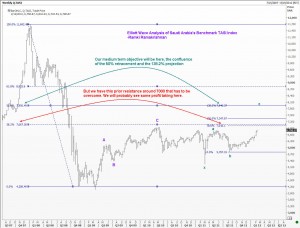
My last Elliott Wave analysis of Saudi Arabia’s TASI index was back in July 2011, and a lot has happened since then. The index has powered ahead from a low of 5795 posted in August 2011 to the current level of 6780, a handsome 17% gain. In the big picture, I feel we could see a move to 7940, but there are some hurdles on the way, mainly around the 7000 level. Immediate supports lie at 6650, and stronger supports further down at 6500.
Saudi Equity Index Saudi Index Tadawul TASI
Share. Facebook Twitter Pinterest LinkedIn Tumblr Telegram Email
Previous ArticleElliott Wave update for New Zealand Dollar
Next Article Elliott Wave Analysis of EUR/USD (EURUSD=X) – ccy
Ramki
  • Website

Related Posts

Elliott Wave Analysis of Saudi Stock 2100

November 23, 2015

TASI MAGIC

February 12, 2013

Elliott Wave Analysis of Saudi Index TASI

July 18, 2011
View 43 Comments

43 Comments

  1. Fahad on February 12, 2012 6:31 am

    thank you Mr. Ramki for that, i have read the book but i got confused when to decide is the wave abc or 1,2,3,4 & 5.
    can yiu please tell me whats the key to catch the difference or how to decide that?
    appreciate if you could post an analysis of SABIC since long back we were waiting for that. pleeeeease

    Reply
    • Ramki on February 12, 2012 9:20 am

      Hi Fahad, After a 5 wave impulse move, you will count abc, provided the just finished 5 waves is not a C wae in itself. Best to go back and read the book carefully one more time! Good luck

      Reply
  2. Ibrahim on March 1, 2012 2:32 am

    Hi Ramki
    It seems that Tasi ignored any profit taken at 7000 and kept raising up to 7200 level ,so when do we expect Tasi to take profit and where will be the support level that may reach to and reverse direction from it .
    Regards,

    Reply
    • Ramki on March 1, 2012 7:54 am

      Hi Ibrahim, I need to see the charts before commenting…and I am still on holidays

      Reply
  3. Fawaz on March 22, 2012 5:59 pm

    Dear Ramki,
    Thanks for your information and we need your updated please about TASI because I see coming a weak in grose up while money flow and valume are coming high. So we need your support to see and update the TASI sharts. I appreciate your efforts.

    Thanks and Best Regards

    Reply
  4. Fahad on April 8, 2012 9:59 am

    dear Ramki,
    its WOW!!
    I am really amazed, Saudi’s index fell rapidly from 7940 that point you have idetfied accurately in this post
    http://www.wavetimes.com/elliott-wave-analysis-of-saudi-arabias-tasi-index/
    the highest point is very clear thru this link:
    http://tinyurl.com/d52vfxo
    where the 52 week high is shown on 3 April 2012 at 7,930.58
    Can you please update the med & long term of saudi index?? please Ramki.

    Wow!

    Reply
    • Ramki on April 10, 2012 10:00 pm

      HI Fahad, Sayeed and Ibrahim and others.. The TASI index has support around 7325/35. Expect some recovery from there.

      Reply
  5. Sayed on April 9, 2012 1:01 am

    This is amazing. I fully agree with Fahad. And I join him in requesting you for an update. Please do update your view on TASI over the next one year (or so) timeframe. Particularly, will it be a good thing to enter fresh positions at 6500 or thereabout.
    Thanks
    Sayed

    Reply
  6. Ibrahim on April 10, 2012 7:42 am

    We really need to see an update for our TASI from you Ramki .

    Reply
  7. Sayed on April 11, 2012 5:19 am

    Thanks for the update. Will 7325 be a nice place to enter fresh positions to hold for the next one year ? I ask this only because I believe SPX should be bottoming out around 1310 in the coming weeks. And if SPX goes down by 47 points should TASI go further below its current low of 7368 ?
    Thanks once again!

    Reply
    • Ramki on April 11, 2012 11:35 am

      Hi Sayed, thanks for your comments. I am currently not offering any trading advice on WaveTimes. Best wishes

      Reply
      • Aziz on April 15, 2012 2:19 pm

        Hi Ramki, could you please update your Elliott wave analysis for TASI, please.. I don’t want any trading advice, just update. Thank you for your efforts …

        Reply
        • Ramki on April 15, 2012 11:49 pm

          HI Aziz, DOing a chart takes me too much time..watch supps around 7325 and then 7100/ Resistance at 7550

          Reply
          • Aziz on May 19, 2012 3:53 pm

            Thanks for you replay and I can imagine how busy you are. The wave b was around your expectation, well done..

  8. Sayed on April 12, 2012 3:18 am

    Let me know how I can get trading advice from you.

    Reply
    • Ramki on April 16, 2012 12:18 am

      Sayed, At present I only offer seminars to leading financial institutions and occasionally groups of high networth individuals.

      Reply
  9. saad on May 9, 2012 11:58 am

    l really appreciate your efforts.

    You said above the recovery point will be 7350
    I would like to know in short sentence:
    1- After the Saudi Stock Market closing on Wednesday, where are we heading?
    2- How much you are confident that for point 7209 to be the recovery point?

    Reply
    • Ramki on May 9, 2012 9:57 pm

      Hello Saad, Yes, from 7350 the index went to 7604 before coming down to 7210. Then it recovered to 7639 again before coming off again. Saad, as I mentioned earlier, it is very hard to offer regular advice as I am a full-time bank treasury manager. This blog is only a hobby and a way to connect to my friends around the globe. Anyway, safe supports come at 6915 and 6875. SOmetime in June, Thomosn Reuters are planning to sponsor my seminar in Riyadh. You may contact your local Reuters to reserve your place, if you like

      Reply
      • Aziz on May 19, 2012 3:59 pm

        Thank you for above information and we will be happy to see you in Riyadh, when this seminar will be? I hope it is not between June and August, as the temperature might exceed 50 during those three months…
        Regards,

        Reply
      • Abdallah on May 22, 2012 12:22 pm

        Hello Ramki,
        Thank you for your valuable comments and the time you spend answering your followers questions,this is great gesture.
        Can you tell me please, when the TASI recovers,how far will it go upward and do you believe the overall downward direction has ended and now we are in a new upward cycle or,we might see another new bottom recorded.
        Thank you again and look forward to see you in Riyadh next month.

        Reply
        • Ramki on May 23, 2012 7:21 am

          Hi Abdallah, sorry but I need to see my charts. Besides, wavetimes is a place where you come to learn Elliott waves so you can figure these questions yourself!

          Reply
  10. Sayed on June 2, 2012 1:38 am

    Dear Ramki
    I am sure you are enjoying your holidays. When it becomes possible please let us know supports below 6875. I was presuming SPX is bottomed out somewhat so kind of believed this support; but Friday action in other markets has pushed TASI down to 6700 levels.
    Where next below 6875 ?
    Thanks a ton
    Sayed

    Reply
  11. Sayed on June 4, 2012 9:39 pm

    Hi Ramki
    Sorry for another update to my earlier comment. But I just came back here looking if you were able to read my comments. In doing so I scrolled up a bit to find my comment dtd April that asked if 6500 is a safe place for fresh positions of 8 months plus ?
    I think I had deduced the 6500 from DJIA & SPX projections. Believe me I am no Elliott Wave or any other wave learner; I just have a simple mathematical/statistical model that works intraday/intraweek and extremely longterm timeframes. I can’t see midterm; but my Saudi friend has been pestering me for place to enter fresh positions.
    If you can help, that will be great.
    Thanks

    Reply
    • Ramki on June 5, 2012 5:00 am

      Hi Sayed, thanks for writing. Wavetimes is only helping people learn Elliott waves..

      Reply
  12. ُُُEmad on June 20, 2012 1:02 pm

    Kindly we need your update by charts…

    Many thanks for your usual support…

    Reply
  13. Yasser on July 4, 2012 11:21 am

    Hi Ramki,

    Hope all is well.

    Been some time havent seen your updates on the MENA region, especially on Saudi Arabi & Dubai .

    Looking forward for your updates.

    Really appreciate all your efforts and the knowledge you provide for your readers.

    Yasser

    Reply
  14. Yasser on July 11, 2012 12:54 pm

    Hi Ramki,

    Hope to see your update on Saudi Stock Market.

    Thanks in Advance

    Reply
  15. mohammed on August 3, 2012 6:04 pm

    Kindly we need your update by charts…

    Many thanks for your usual support…

    Reply
    • Ramki Ramakrishnan on August 5, 2012 12:18 am

      MOhammed, I will try, but been a bit busy lately

      Reply
  16. Fahd on September 26, 2012 4:26 pm

    Dear Ramki,
    Kindly we need your update for saudi TASI Index, because really we don’t know now where our TASI Index goes. Is it will go more deep down or will stop in this point or will return back and go up.
    Many thanks for usual support and really we need your help in this moment from your time to show us our TASI Index

    Reply
    • Ramki Ramakrishnan on September 27, 2012 12:21 pm

      Hi Fahd, I hope you are not one of those who visit Wavetimes for trading ideas! Once you learn my methods, you can figure out for yourself where TASI will go. It is not that difficult. ( FWTFF is also available in Arabic) Anyway, I will try and look at that chart in the near future. Good luck

      Reply
  17. Man on December 1, 2012 9:44 am

    September 27, 2012 at 12:21 pm
    I will try and look at that chart in the near future.

    Reply
    • Ramki Ramakrishnan on December 3, 2012 12:51 pm

      Man, sorry about the delay..

      Reply
      • Emad on December 17, 2012 2:21 pm

        Your update if possible

        Reply
        • Ramki Ramakrishnan on December 27, 2012 8:26 am

          EMad, I have replied to another comment today. please read that

          Reply
  18. Man on December 22, 2012 8:20 am

    Dear Ramki,
    Are you planning to have a look to TASI.
    Regards

    Reply
    • Ramki Ramakrishnan on December 27, 2012 8:13 am

      HI Man, Yes, I looked at it just now for you. Observe that we have retraced 61.8% of the move from 7185 to 6421 and hence the index is showing signs of fatigue. You should now lighten up on longs and wait for a decent correction before buying again.

      Reply
  19. Man on December 27, 2012 1:13 pm

    Dear Ramki
    Thank you for your kind observation. My confusion that I see 2 scenarios
    A. Profit taking to 6700 ( 38.2% )
    B. Expanding-Diagonal / correction to 5750
    In both 7185 resistance will lead to midterm objective 8400/8500
    Your kind thought is highly appreciated

    Reply
  20. man on December 29, 2012 8:20 am

    Dear Ramki
    Would you please elaborate in the big picture (ref. your chart of Feb 12, 2012).
    Are we in wave 5 of 3 of basic 3 in your earlier observation it seem we will be in 4 of basic 3 soon
    Regards,

    Reply
    • Ramki Ramakrishnan on December 30, 2012 10:37 pm

      Hi Man, It is 10 months since I wrote that! Will have to look at the chart tomorrow. But don’t bother about such an old count. You take the current chart and start counting afresh. Go to it with a fresh mind. The market always gives you more clues with passage of time. good luck

      Reply
  21. Man on December 31, 2012 6:05 pm

    Dear Ramki
    Thank you for your kindness. Looking for your updated look/chart tomorrow.
    Regards,

    Reply
  22. saudi_guy on February 8, 2013 11:40 pm

    good day

    we all waiting for your update and we all sure that you will support us by updating the saudi index … im checking your site every day lloking for your update . please

    thank you

    Reply
  23. Emad on March 28, 2013 4:05 am

    Hi Ramki ..
    Do you have any training course coming.. If yes pls tell me where and when..
    Best Regards,

    Reply

Leave A Reply Cancel Reply

Recent Posts
  • Has Meta (Facebook) stock seen the bottom
  • What Is The Nearest Technical Support For Meta (NASDAQ: FB)
  • Using Elliott Waves to Capture a Trade in S&P500
  • Hedge Funds and Elliott Waves – Netflix $NFLX
  • When Elliott Waves applauds the promoter’s signals!

WaveTimes is a Research Organization dedicated to providing original analysis, reports, reviews, and insights on developments in mutual funds, stocks, investing, foreign exchange, commodities, and bonds.

Contact WaveTimes

L-601 Mantri Espana,

Kariyammana Agrahara, Bellandur, Bangalore 560103

Follow Us

  • Facebook
  • YouTube
  • Twitter

© 2023 Wave Times. All Rights Reserved.
  • About
  • Books
  • Privacy Policy
  • Policies and Standards

Type above and press Enter to search. Press Esc to cancel.