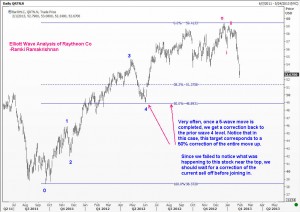
Today I present you with my Elliott Wave Analysis of Raytheon Co. Use these Elliott Wave Charts to learn how to anticipate market turns. It is possible for a careful trader to sit patiently and wait for great opportunities like these. The mistake most of us make is we get impatient, both to enter the market and to take profits. To make it worse, we are willing to wait for ever to cut a loss-making trade because we become hopeful that the market will come back to our breakeven rate! We do all this even though we know we shouldn’t be doing it. That is human nature. To control such behavior you need either someone else to tell you when to get out, or have an iron will and discipline to follow your own rules. Good luck.