• About
  • Elliott Waves
    • Elliott Waves Explained
    • Elliott Wave Magic Illustrated with Wave Charts
    • Elliott Wave Edge – How Elliott Wave Traders Win
    • Fibonacci Number Series and Elliott Waves
    • How to use Fibonacci Ratio Retracements
    • Elliott Wave Books
      • The Elliott Wave Book – Five Waves to Financial Freedom
      • Dividend Growth Investing Using Elliott Waves
    • Videos
  • Equities
    • Indices
      • Africa
        • Egypt
      • Australia
      • European Indices
        • AEX – Index, Amsterdam
        • DAX Index
        • Istanbul
        • Russia
        • Spain’s IBEX 35
      • Asian Indices
        • India
        • China
        • Dubai
        • Kuwait
        • Kuala Lumpur
        • Pakistan
        • Saudi
        • Taiwan
      • US Indices
        • S&P500
        • Nasdaq
        • Dow Jones
        • Dow Jones Utilities
    • Stocks
      • Asian Stocks
        • Indian Stocks Trading
        • Dubai Stocks Outlook
        • Japanese Stocks
        • Kuwait stocks
        • Saudi Stocks Outlook
      • African Stocks
        • Egyptian Stocks
      • Swiss Stocks
      • Australian Stocks
      • European Stocks
      • US Stocks outlook
      • UK Stocks
  • Commodities
    • Copper
    • Gasoline
    • Gold
    • Natural Gas
    • Oil
    • Palm Oil
    • Raw Sugar
    • Rubber
    • Soybean Oil
    • Silver
  • Forex
    • AUD
    • Bitcoin
    • CAD
    • CHF
    • Euro
    • GBP
    • INR
    • NZD
    • JPY
  • Raves
  • Consulting
    • Consulting
  • Ramki’s Watchlist
Top News

Has Meta (Facebook) stock seen the bottom

March 21, 2022

What Is The Nearest Technical Support For Meta (NASDAQ: FB)

February 7, 2022

Using Elliott Waves to Capture a Trade in S&P500

January 27, 2022
Facebook Twitter Instagram
WaveTimes Blog WaveTimes Blog
Wave times
  • About
  • Elliott Waves
    • Elliott Waves Explained
    • Elliott Wave Magic Illustrated with Wave Charts
    • Elliott Wave Edge – How Elliott Wave Traders Win
    • Fibonacci Number Series and Elliott Waves
    • How to use Fibonacci Ratio Retracements
    • Elliott Wave Books
      • The Elliott Wave Book – Five Waves to Financial Freedom
      • Dividend Growth Investing Using Elliott Waves
    • Videos
  • Equities
    • Indices
      • Africa
        • Egypt
      • Australia
      • European Indices
        • AEX – Index, Amsterdam
        • DAX Index
        • Istanbul
        • Russia
        • Spain’s IBEX 35
      • Asian Indices
        • India
        • China
        • Dubai
        • Kuwait
        • Kuala Lumpur
        • Pakistan
        • Saudi
        • Taiwan
      • US Indices
        • S&P500
        • Nasdaq
        • Dow Jones
        • Dow Jones Utilities
    • Stocks
      • Asian Stocks
        • Indian Stocks Trading
        • Dubai Stocks Outlook
        • Japanese Stocks
        • Kuwait stocks
        • Saudi Stocks Outlook
      • African Stocks
        • Egyptian Stocks
      • Swiss Stocks
      • Australian Stocks
      • European Stocks
      • US Stocks outlook
      • UK Stocks
  • Commodities
    • Copper
    • Gasoline
    • Gold
    • Natural Gas
    • Oil
    • Palm Oil
    • Raw Sugar
    • Rubber
    • Soybean Oil
    • Silver
  • Forex
    • AUD
    • Bitcoin
    • CAD
    • CHF
    • Euro
    • GBP
    • INR
    • NZD
    • JPY
  • Raves
  • Consulting
    • Consulting
  • Ramki’s Watchlist
WaveTimes Blog WaveTimes Blog
Home » Elliott Wave Analysis of Nifty
India

Elliott Wave Analysis of Nifty

RamkiBy RamkiJuly 3, 201363 Comments1 Min Read
Facebook Twitter LinkedIn Telegram Pinterest Tumblr Reddit WhatsApp Email
Share
Facebook Twitter LinkedIn Pinterest Email

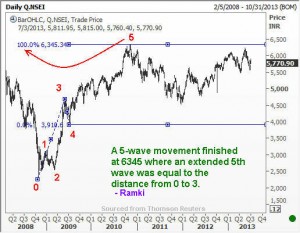
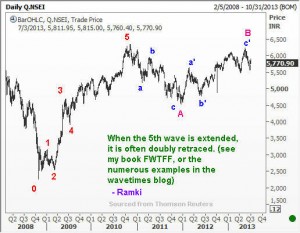
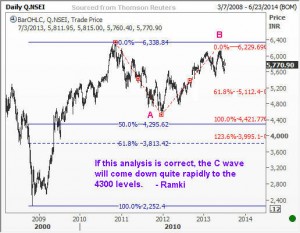
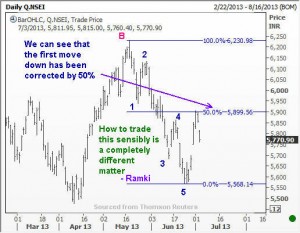
Hello Traders from India. I know you have all been patiently waiting for some indication about your famous NIFTY index. This post will attempt to give you an idea of my current thinking. As you all know, I am not offering any trading advice on this blog. Members of the exclusive club get to see how I would actually trade using Elliott Waves. However, there is enough material here for you to do your own thinking. Good luck!

Nifty
Share. Facebook Twitter Pinterest LinkedIn Tumblr Telegram Email
Previous ArticleElliott Wave Trade in Reliance Communications
Next Article Elliott Wave Analysis of Karachi Stock Index
Ramki
  • Website

Related Posts

How Elliott Waves helped WaveTimes members to exit before the stock market crash

March 27, 2020

How we traded Castrol India using Elliott Waves

December 9, 2019

Nifty rallied up in 5 waves

July 10, 2015
View 63 Comments

63 Comments

  1. Piyush Chaudhry on July 3, 2013 4:16 pm

    Thank You.
    Awesome Work.

    Reply
  2. Samay gupta on July 3, 2013 5:08 pm

    dear sir,
    in above picture it is also clear that nifty crossed reflex point at 5863.4 and went high 5904.35..and then coming back down…now as per your book once it breached reflex point…we need to buy dips at 50% or 61.8% for upside..
    Atleast can we see 61.8% retracement till 5970…

    Reply
    • Ramki Ramakrishnan on July 5, 2013 11:35 am

      Samay, you are asking me to predict the next move. Now that you have a basic understanding of EWP, why don’t you do some paper trades and see how it turns out? As you gain more experience, put real money and also do sound money management into practice.

      Reply
  3. BK on July 4, 2013 9:28 am

    Ramki,

    Could you do an update on Pakistan’s KSE-100. It has again been one of the strongest markets in the world.

    It made a high in June and sold off -8.5% but the reaction from 21,000 will look impulsive if it can retake 22,000.

    The KSE-100 really is in a world on its own!

    IMHO I think that we are approaching a top which should see the market revert to the 200-DMA, which is currently +22% below price. Question is have we topped in June or do we make a new high around 24,000 before that happens.

    LT however the count to the upside is far from complete and this market should continue to be a big outperformer in the years ahead.

    Please can you have a look at where we think we are in the count.

    Best

    BK

    Reply
    • Ramki Ramakrishnan on July 5, 2013 11:27 am

      Hi Bilal, Sure, It has been a while since I looked at Pakistan’s index. Will take a look next week.

      Reply
      • BK on July 11, 2013 11:15 am

        Thanks Ramki, look forward to it.

        Best to you,

        BK

        Reply
        • Ramki Ramakrishnan on July 12, 2013 8:33 am

          Bilal, sorry I completely forgot! Will try and post my comments soon.

          Reply
  4. himansu m. mehta on July 4, 2013 10:31 am

    the 5 wave completion at 6338 was a Wave I, III or V of a larger cycle ?

    Reply
    • Ramki Ramakrishnan on July 5, 2013 11:26 am

      Himansu, Does it really matter for our trading results? The question is more academic than practical,and your time is better spent figuring out a trade from what you know currently. In the big picture, we always have the flexibility to change our counts.

      Reply
  5. Piyush Goyal on July 4, 2013 11:04 am

    Sir,
    I am a novice in Elliot wave analysis and am quite facinated with your analysis. It has also solved many of my confusions regarding current nifty/sensex movement.

    Ref Fig 2 above I would be grateful if you could guide me for sub wave calculation from b’ to c’ of B wave.(I am little confused)

    Also I was/am expecting Nifty to complete H&S pattern at around 5970 – 6000 level (might be c wave of first down move as in Fig 4.). Now my question is weather correction is over at 50% or we may go for 68.2% retracement at around 5980.

    Piyush Goyal.

    Reply
    • Ramki Ramakrishnan on July 5, 2013 11:24 am

      Piyush, May I suggest that you read a good book for this? Also, be aware that all wave counts are only work-in-progress. As the moves unfold, the markets will instruct us what to do next. These are explained in my book FWTFF.

      Reply
      • Piyush Goyal on July 22, 2013 11:34 am

        Sir,
        Thanks for your reply. Now as per current chart, correction to the first down move has retraced 76.4%. Now I think we can assume that if Nifty crosses 6230 level then 5th wave is in progess as per Rohit & Prabh’s view, otherwise we will resume the second down wave of C wave. What’s do you say?
        Piyush.

        Reply
        • Ramki Ramakrishnan on July 23, 2013 6:52 pm

          Piyush, My first recommendation to you is to stop scouting around for different people’s interpretation. It is a serious waste of time. Why don’t you do the analysis yourself and know where you will go wrong. Unless someone is going to instruct you step by step where to enter the market, why you should enter, where your stop loss will be, how you will manage the position, when a certain interpretation is going to be wrong, etc etc, you are not doing yourself any good.

          Reply
  6. Rohit Srivastava on July 4, 2013 11:28 am

    Very much agree on the big picture but have had quite a debate with my elliotticians on the short term 5 wave decline having formed. It appears 3 waves in some ways. Though what you have marked does have very good Fibonacci ratios for a 5. This bothers me, what am I missing?

    Reply
    • Ramki Ramakrishnan on July 5, 2013 11:22 am

      Rohit, you are not missing anything. At many stages in a move, several counts are possible. Stick with one until you are proved wrong.

      Reply
      • Prabh on July 9, 2013 5:23 pm

        Ramki Sir,

        Your daily wavecount does not exhibits presence of any complex correction.According to FWTFF one of the corrective Wave has to be complex in nature hence my thought process also goes with Rohit that Wave 5 marked by you seems to be end of Wave 3 and Wave 4 is currently is progress depicting some signs of complex correction.

        Reply
        • Ramki Ramakrishnan on July 10, 2013 7:00 pm

          Hi Prabh, I don’t read others’ analysis and you too should not. Follow your own counts. This is what I keep repeating as the ‘mantra’ to all who go in search of what is the right count.

          Reply
  7. Mukund Sane on July 4, 2013 5:53 pm

    I am currently to take such studying your book. Am also trying to read the wave count of the current moves. Never thought of going back as far as 2010 and beyond. But your post gives a lot of clarity to the current moves.

    Reply
    • Ramki Ramakrishnan on July 5, 2013 11:18 am

      Mukund, the learning never stops! All the best.

      Reply
  8. Sunny GAMBHIR on July 4, 2013 9:00 pm

    Dear Mr Ramki,

    It was a wonderful experience reding some of your view/finding. I am a very disciplined positional trader and Always on for a look out of a good technical guys and I and glad to tell you that you are one of them to whom I would like to follow.
    So please advice if there is any particular kind of services you are rendering currently, if yes then please revert and advice, would subscribe it there and then.

    Waiting for your valuable reply.
    Thanx
    Sunny Gambhir
    M-0091-99999-99399.

    Reply
    • Ramki Ramakrishnan on July 5, 2013 11:17 am

      Sunny, Thanks. Elsewhere in the blog you can read about the exclusive club. See if that fits your style. Good luck.

      Reply
      • JITENDRA SHINDE on July 13, 2013 9:55 pm

        NIFTY WILL TOUCH MOST PROBABALY 6088 ON 16.7.13
        AND DOWN LEG WHICH HAS ALREADY STARTED WHEN NIFTY FELL FROM 6229TO 5566.WHICH COMPLETED THE 1ST LEG OG FALL.
        NOW 2ND WAVE WILL GO UPTO 6088 AND 3 WAVE WILL COMMENCE FOLLOWED BY SHALLOW 4TH WAVE AND 5 TH WAVE WILL BREAK OR AT LEAST TOUCH 4531 TO COMPLETE THE CORRECTION.

        Reply
  9. Amarnath on July 5, 2013 12:25 am

    Dear Sir,

    When Nifty reach above 6000 in Jan of this year and went down to 5500, I had
    thought wave C started. However, Nifty made a higher high in May. How can
    we be sure that wave B has now ended. It could be that the correction in June
    was still part of wave B and we are yet to make another high.

    Thanks,
    Amarnath

    Reply
    • Ramki Ramakrishnan on July 5, 2013 11:15 am

      Amarnath, Good question. This is why I said that trading the moves is a completely different thing. Getting a wave count in front of you is one part of the equation. Knowing where it makes sense to get involved , when you will know that something is going wrong, etc are a bunch of different things that needs a trader mind set. A combination will yield success.

      Reply
      • Amarnath on July 23, 2013 5:28 pm

        Dear Sir,

        Now with Sensex making new 52 week high and Nifty
        close to its 52 week high, does that change your viewpoint ?
        Do you think we are still in wave B and are topping out ?
        I have no doubt in your analysis that wave C will take Nifty
        down real fast, however it seems impossible to time the
        start of wave C. I got fooled in Jan and then again in May.

        Also, does wave C have to end below wave A ? wave A ended
        at around 4500 in Nifty. Does this mean wave C would
        take Nifty down below 4500 ?

        BTW, I am a US resident and have no way of trading in
        Nifty/Sensex. I am doing this only for educational
        purposes.

        Thanks,
        Amarnath

        Reply
        • Ramki Ramakrishnan on July 23, 2013 6:44 pm

          Amarnath, when one wishes to do a trade, he starts with a framework, a hypothesis. I gave my hypothesis in that blog post, in the last few months I have not initiated any short position in Nifty. Once I prepare my hypothesis, I lie patiently in wait for the opportune moment to enter a low-risk trade. Those who are impatient, and try to pick tops at every fibonacci level are bound to be disappointed. This is the essence of what I have tried to convey in my various blog posts on different instruments

          Reply
  10. nishant on July 5, 2013 6:09 am

    Thank You Ramki for Nifty Analysis.

    Reply
  11. Anandha on July 11, 2013 3:37 pm

    Hi Ramky,

    Are you still intact with your view of Nifty visitng/having sharp fall to 4800 levels? Or you think you need to revist your wave counts?

    Reply
    • Ramki Ramakrishnan on July 12, 2013 8:29 am

      Hi Ananda, my nifty comments were posted to get you thinking. The question to ask oneself is where can we trade the outlook from, and when will the count be proved invalid and hence corrective measures taken. This is what I meant by saying trading the index is a completely different thing.

      Reply
  12. Mihir on July 12, 2013 5:08 pm

    Liked your nifty analysis.
    how can i get the your book?

    Reply
    • Ramki Ramakrishnan on July 13, 2013 11:48 am

      Hi Mihir, There is an image of the book on the right hand side, try clicking on that for more information.

      Reply
  13. RainMaker on July 12, 2013 6:11 pm

    Sir,

    I have a small query, if time permit please do reply.

    When triangles are formed ( in wave 4 or wave B), for calculating targets should we take the lowest point (a) or end point (e) of the triangle for anticipating /measuring the end of the next wave

    Here is a current chart of NIFTY on hourly time frame, probably it helps you to understand my question.

    LINK: http://img713.imageshack.us/img713/6356/e15z.png

    Reply
    • Ramki Ramakrishnan on July 13, 2013 11:47 am

      Hi Rainmaker, Good question and nicely illustrated which other readers can benefit from. I would compute the C wave from the ending point of the triangle, which is point ‘e’. That happens to be the end of the B wave in a triangular formation. Classical analysts would measure the widest height of the triangle and add it to the breakout point on the upper line. You could use that as an added confirmation if your targets are corresponding. Good luck.

      Reply
      • Samay gupta on July 13, 2013 12:35 pm

        Thanks alot for my query,
        So far it moves above reflex point and then retraces down 38.2%…when i mailed you and aksed to buy for up move either C or 3rd wave..but it didn’t went up directly but in form of triangle…is it 2nd wave or B wave..can triangle occur in 2nd wave..
        Now nifty moving above thrust of triangle forcefully and on monthly chart it crosses above all june highs..is it powerfull 3rd wave coz so far there is no momentum loss…Shekhar’s target 6138 looks ideal for C wave …sir please light on whether we can expect something big like 6500-7000 in nifty is there any probability…thanks

        Reply
        • Anandha on July 15, 2013 5:44 pm

          Nice one. Well illustrated.

          Reply
      • RainMaker on July 13, 2013 6:27 pm

        Thanks for response and encouragement.

        For now I shall keep an eye on the 5 sub waves of wave ‘C’.

        Reply
  14. Saumya on July 20, 2013 4:16 pm

    Dear Ramki

    Thanks a lot for Nifty Analysis.
    An in-depth analysis thro charts.
    A request, please increase the frequency of your posts on Nifty analysis.
    At least once in 3 months.

    Thanks

    Reply
    • Ramki Ramakrishnan on July 22, 2013 7:59 am

      Saumya, thanks and sure, will try to do that

      Reply
  15. kaushal on September 13, 2013 8:24 am

    SIR, I M POSITIONAL TRADER AND I WANT TO APPLY WAVES ON MY ANALYSIS BUT SIR I HAVE A QUERY THAT WHAT TIME FRAME I SHOULD USE TO SPOT SMALLER WAVES FOR DETERMINE WAVES ON LONGER TERM TIME FRAME . I MEAN SHOULD I USE HOURLY TIME FRAME ? OR 15 MINUTE TIME FRAME ? OR 30 MINUTE TIME FRAME ? FOR SMALLER WAVES COUNTS? PLEASE REPLY MY QUESTION SIR.

    Reply
    • Ramki Ramakrishnan on September 13, 2013 12:30 pm

      Kaushal, there is no standard formula for this. Generally speaking, you decide where a wave of a larger time frame will likely end, and use any of the shorter time frame to add conviction to your decision that a bottom or top is in place. You should not use these shorter time frames to trade if you are a position taker.

      Reply
      • prabh on September 14, 2013 12:47 pm

        Ramki Sir,

        I am having a same question on same topic.Will highly appreciate if you clear the below doubt.

        Suppose if we counting internal waves of a particular impulsive wave,on higher time frame(say weekly).Then how much clearity or conviction should exists on higher time frame. before we conclude that impulsive wave is about to finish.If say,we are not convinced presence of 5 internal waves but on small time frame (say daily or hourly) we are able to locate 5 internal waves,can we then on higher timeframe conclude that particular impulsive wave has ended or shall we wait on higher timeframe presence of 5 internal waves.

        Reply
        • Ramki Ramakrishnan on September 17, 2013 6:46 pm

          Prabh, When you look at a chart, the waves should be so obvious to you that there need not be much doubt in your mind. You should only get involved in such occasions. If you try to queeze every sqiggle into a bigger count, or ponder why the larger waves seem to have complex internal waves, you are setting yourself to alalysis-paralysis!

          Reply
  16. Samay Gupta on September 13, 2013 4:13 pm

    Sir,
    Very well presented chart and Nifty fallen heavily after your call..and reversed back up also very sharply….where other indices still battered heavily so can we expect down in nifty considering current move an X wave after ABC for your ultimate target 4400..?
    Kindly provide follow up your analysis..i will be really thankful

    Reply
    • Ramki Ramakrishnan on September 17, 2013 7:02 pm

      Samay, please read my responses to various similar questions on this subject

      Reply
  17. Sailesh on September 13, 2013 5:47 pm

    DEAR SIR,
    AFTER HITTING LOW OF 5100, NIFTY NOW AT 5900 LEVEL , PLEASE UPDATE YOUR VIEW ARE YOU STILL EXPECTING 4300 LEVEL?

    The upward move was quiet fast so please check the counts and update your view

    Thank you
    Sailesh jain

    Reply
    • Ramki Ramakrishnan on September 17, 2013 7:01 pm

      Sailesh, The 4300 outlook obviously went to the back burner as soon as we goyt the aggressive move the first day after we reached 5118. Never get married to a wave count. Just have it as your girl friend!

      Reply
  18. Akhil on September 16, 2013 5:53 pm

    Sir

    Nifty has progressed as you predicted but the current move from 5119 to 5957 seems to be swift. Can we label this as ‘x’ wave and if so how far do ‘x’ waves usually retrace.
    cuz the fall has retraced more than 80% of last fall that is from 6093 to 5119
    so is it that i would have to move to next retrace from 6229 to 5119.

    also can an ‘x’ wave retrace more than 100% i.e above 6229 if so how would it effect the wave count

    Thanks

    Reply
    • Ramki Ramakrishnan on September 17, 2013 6:38 pm

      Akhil, The original wave count served us well until it reached 5118. When it started aggressively moving higher, it was time to put that count in the back burner and trade the new wave up. This is how my approach to Elliott Waves is different from all the others, because we have to use the tool to trade the markets, not to come up with accurate forecasts.

      Reply
      • Piyush Goyal on September 20, 2013 5:35 pm

        Sir,
        I was assuming the move from 5118 to say 5600 was possible to be 4th wave of C wave and after that 5th wave could hav completed near our tgt. As an EW analysis when can one put the count in back burner??How at 5118??
        Piyush.

        PS: It’s very easy to say after the move but as per my knowledge EW analysis is for prediction rather then trend follow.

        Reply
        • Ramki Ramakrishnan on September 23, 2013 4:00 pm

          Piyush, your difficulty arises because you are approaching the market with a fixed mind set, expecting it to behave as you would expect it from your current knowledges of EWP. Banish that from your mindset. Instead, think how you can use EWP to trade effectively. When a count appears incorrect, feel free to modify. You should have entered the trade at a level where the profits are large and risk small. If you did that, getting out of a position will not be painful. Putting a wave count in the back burner is just letting go of your previous count

          Reply
      • Prabh on September 23, 2013 9:19 am

        Ramki Sir,

        Since earlier wave count on back burner can we say that ongoing wave is a start of new impulsive wave (bull market)?

        Reply
        • Ramki Ramakrishnan on September 23, 2013 4:11 pm

          Prabh, putting a wave count in the back burner means I am looking to start my count from the latest significant low to trade the current move and will return to the next higher degree when there are additional clues

          Reply
  19. Gunjan on September 19, 2013 2:32 am

    Sir,

    My concern is if all this move from 5900 to 5118 was just minor wave a”of major C correction or the full major C correction itself.
    The only thing that is confusing is time taken to complete this move.Though we all know only two waves moves so swiftly 3-3 and c-3..so this may be a possibility now that we are in reactive wave up and corrective wave down..??
    Moreover if we look at the corrective pattern the last leg down do complete the requirements of the completion of the correction.

    Reply
    • Ramki Ramakrishnan on September 23, 2013 4:09 pm

      Gunjan, the fact that you are thinking in terms of wave personalities is itself a sign that you are in track to become profitable. Next, develop a sense of timing, choosing low risk points in the direction you’d wish to trade.

      Reply
  20. Dylanfan on September 19, 2013 5:50 pm

    Sir

    please find the below link
    http://img12.imageshack.us/img12/1074/6150.png
    it has two views one in green(bullish) label and the other in red (bearish)

    my question is can ‘B’ take such a long time in this case 5 yrs in the making (red label) if not than can ‘C’ be the shortest wave (green label) done at 4531 and we are heading higher.

    confused with both views could you please shed some light sir

    thanks

    Reply
    • Ramki Ramakrishnan on September 23, 2013 4:04 pm

      Dylanfan, I seldom look at such long term charts because it is not going to help me make money. Your question is purely academical. Regards

      Reply
  21. prabh on September 23, 2013 5:22 pm

    Many thanks Ramki Sir for replying to all the queries.Unfortunately there does not exists any “Thanks” button on the blog hence kindly consider this message as my thanks from bottom of my heart.

    Reply
  22. Arvind Kapur on October 10, 2013 3:39 pm

    Dear sir,
    I gone through the entire blog discussion, basically coming to the view that you have not given any new analysis regarding the India nifty counts and that you have no idea to where nifty may be heading in the future. Only evasive answers. Plead give your idea to where nifty is head with changed analysis and wave counts if u can…..

    Reply
    • Ramki Ramakrishnan on October 11, 2013 11:53 am

      Dear Arvind, Thank you very much for your comments. May I give you two additional insights? (a) Seeking absolute inevitability in any form of analytical principle is bound to lead to totally unsatisfactory results. (b) I have absolutely no idea about where not only Nifty, but about every asset class may be heading in the future. What I do know, however, is how to use Elliott Waves to trade! Good luck.

      Reply
  23. swami on October 13, 2013 4:13 am

    Respected Guruji
    Your writings taught me how to make money with higher probability than any other technique I have come across.
    You have made me independent rather than a follower.
    Thanks & Regards.

    Reply
  24. DHAVAL on November 2, 2013 1:11 pm

    Dear sir,

    Current rally from 5119 to 6332 formed 5-3-5 waves pattern in daily charts.Is it A-B-C correction.

    Reply
  25. Sahil on March 28, 2014 4:30 pm

    I believe this is the last update on Nifty. Its about to be 8 months from the last post and Nifty closed with a new high..
    Can you share your views on how you see the Roadmap now for the Index.

    Reply
    • Ramki Ramakrishnan on April 19, 2014 11:24 am

      Sahil, As I have been writing on the Exclusive club about Nifty, it wasn’t right to publish my comments here.

      Reply

Leave A Reply Cancel Reply

Recent Posts
  • Has Meta (Facebook) stock seen the bottom
  • What Is The Nearest Technical Support For Meta (NASDAQ: FB)
  • Using Elliott Waves to Capture a Trade in S&P500
  • Hedge Funds and Elliott Waves – Netflix $NFLX
  • When Elliott Waves applauds the promoter’s signals!

WaveTimes is a Research Organization dedicated to providing original analysis, reports, reviews, and insights on developments in mutual funds, stocks, investing, foreign exchange, commodities, and bonds.

Contact WaveTimes

L-601 Mantri Espana,

Kariyammana Agrahara, Bellandur, Bangalore 560103

Follow Us

  • Facebook
  • YouTube
  • Twitter

© 2023 Wave Times. All Rights Reserved.
  • About
  • Books
  • Privacy Policy
  • Policies and Standards

Type above and press Enter to search. Press Esc to cancel.