• About
  • Elliott Waves
    • Elliott Waves Explained
    • Elliott Wave Magic Illustrated with Wave Charts
    • Elliott Wave Edge – How Elliott Wave Traders Win
    • Fibonacci Number Series and Elliott Waves
    • How to use Fibonacci Ratio Retracements
    • Elliott Wave Books
      • The Elliott Wave Book – Five Waves to Financial Freedom
      • Dividend Growth Investing Using Elliott Waves
    • Videos
  • Equities
    • Indices
      • Africa
        • Egypt
      • Australia
      • European Indices
        • AEX – Index, Amsterdam
        • DAX Index
        • Istanbul
        • Russia
        • Spain’s IBEX 35
      • Asian Indices
        • India
        • China
        • Dubai
        • Kuwait
        • Kuala Lumpur
        • Pakistan
        • Saudi
        • Taiwan
      • US Indices
        • S&P500
        • Nasdaq
        • Dow Jones
        • Dow Jones Utilities
    • Stocks
      • Asian Stocks
        • Indian Stocks Trading
        • Dubai Stocks Outlook
        • Japanese Stocks
        • Kuwait stocks
        • Saudi Stocks Outlook
      • African Stocks
        • Egyptian Stocks
      • Swiss Stocks
      • Australian Stocks
      • European Stocks
      • US Stocks outlook
      • UK Stocks
  • Commodities
    • Copper
    • Gasoline
    • Gold
    • Natural Gas
    • Oil
    • Palm Oil
    • Raw Sugar
    • Rubber
    • Soybean Oil
    • Silver
  • Forex
    • AUD
    • Bitcoin
    • CAD
    • CHF
    • Euro
    • GBP
    • INR
    • NZD
    • JPY
  • Raves
  • Consulting
    • Consulting
  • Ramki’s Watchlist
Top News

Has Meta (Facebook) stock seen the bottom

March 21, 2022

What Is The Nearest Technical Support For Meta (NASDAQ: FB)

February 7, 2022

Using Elliott Waves to Capture a Trade in S&P500

January 27, 2022
Facebook Twitter Instagram
WaveTimes Blog WaveTimes Blog
Wave times
  • About
  • Elliott Waves
    • Elliott Waves Explained
    • Elliott Wave Magic Illustrated with Wave Charts
    • Elliott Wave Edge – How Elliott Wave Traders Win
    • Fibonacci Number Series and Elliott Waves
    • How to use Fibonacci Ratio Retracements
    • Elliott Wave Books
      • The Elliott Wave Book – Five Waves to Financial Freedom
      • Dividend Growth Investing Using Elliott Waves
    • Videos
  • Equities
    • Indices
      • Africa
        • Egypt
      • Australia
      • European Indices
        • AEX – Index, Amsterdam
        • DAX Index
        • Istanbul
        • Russia
        • Spain’s IBEX 35
      • Asian Indices
        • India
        • China
        • Dubai
        • Kuwait
        • Kuala Lumpur
        • Pakistan
        • Saudi
        • Taiwan
      • US Indices
        • S&P500
        • Nasdaq
        • Dow Jones
        • Dow Jones Utilities
    • Stocks
      • Asian Stocks
        • Indian Stocks Trading
        • Dubai Stocks Outlook
        • Japanese Stocks
        • Kuwait stocks
        • Saudi Stocks Outlook
      • African Stocks
        • Egyptian Stocks
      • Swiss Stocks
      • Australian Stocks
      • European Stocks
      • US Stocks outlook
      • UK Stocks
  • Commodities
    • Copper
    • Gasoline
    • Gold
    • Natural Gas
    • Oil
    • Palm Oil
    • Raw Sugar
    • Rubber
    • Soybean Oil
    • Silver
  • Forex
    • AUD
    • Bitcoin
    • CAD
    • CHF
    • Euro
    • GBP
    • INR
    • NZD
    • JPY
  • Raves
  • Consulting
    • Consulting
  • Ramki’s Watchlist
WaveTimes Blog WaveTimes Blog
Home » Elliott Wave Analysis of National Building Const Corp Ltd
Uncategorized

Elliott Wave Analysis of National Building Const Corp Ltd

RamkiBy RamkiJanuary 6, 20135 Comments2 Mins Read
Facebook Twitter LinkedIn Telegram Pinterest Tumblr Reddit WhatsApp Email
Share
Facebook Twitter LinkedIn Pinterest Email

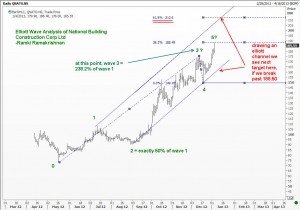
Wow! From a low of Rs 73 in May 2012, National Building Construction Corporation Ltd, an Indian company that offers project management, consultancy services and real estate development etc, has climbed to Rs188. Can this rally be sustained, and if yes, how high can it go? Elliott Wave analysis shows we have reached a first key level already at 188.50, being 38.2% of the distance from 0 to 3 (Remember this from my book “Five Waves to Financial Freedom”?) However, is this the end of the move? The fifth wave seems a bit incomplete and shoudl we break above the 188.50 level the stock could easily run higher to the Rs 212 level, which is the 61.8% measure of the 0-3 distance. Also, when we draw an Elliott Wave channel, by connecting the bottoms of waves 2 and 4 and drawing a paralled via the top of wave 1, we see that the 212 level could be reached in the next week or so. That is about 15% higher than current levels, and so is something traders can keep an eye on.

Remember, this blog aims to teach you how to use Elliott Waves. It is not trading advice! Good luck Ramki

Share. Facebook Twitter Pinterest LinkedIn Tumblr Telegram Email
Previous ArticleJPY, USDYEN Elliott Wave Analysis of USDYEN
Next Article Recent trades
Ramki
  • Website

Related Posts

Merry Christmas and Happy New Year!

December 25, 2021

How to trade using Elliott Wave Analysis – Yes Bank

October 1, 2019

A live example of my trade in Everest Industries

October 31, 2017
View 5 Comments

5 Comments

  1. Piyush Shah on January 6, 2013 5:31 pm

    Hi Ramkiji,

    Just for learning purpose, for National Building count changes & target of 212 gets void if the price is pulled down to 175-170 level in coming days?

    Piyush

    Reply
    • Ramki Ramakrishnan on January 6, 2013 5:56 pm

      Piyush, Remember what is discussed in my book? Look for a 5 wave decline past a reflex point??

      Reply
  2. drsanjaypote on January 6, 2013 5:41 pm

    Great pick dear Ramki and a fantastic low risk high profit trade. The target seems to be quite possible as the daily and weekly momentum indicators are also positive.
    Thanks and Regards.

    Reply
  3. samay gupta on February 17, 2013 9:31 pm

    oh my god this is crazy…when will you update on this post..stock is now at 135..i entered above 188.5…what should i do?

    Reply
    • Ramki Ramakrishnan on February 24, 2013 9:15 am

      Samay, I am sorry to read that you went long at 188.50 and didnt do anything about it until the stock reached 135. First of all, this Blog is meant to teach you ELliott Waves. There is no trading advice here. Secondly, a trader just cannot buy (or sell) and sit around waiting for a profit. He has to manage his positions. He needs to have an affordable stop identified even before he opens a trade. Also, I am not currently able to post updates on this Blog as frequently as before because of my other commitments. In fact, even my resposnes to comments come only on weekends. Finally for NBCC, if you read the comments carefully, you will see that the minimum target for the 5th wave was already met, and while I did expect it to gi higher, (and the stock did produce a profit for you for a few days) the market changed, and you should know that if it didnt prodyce a profit for 3 days, then something is going wrong.

      Reply

Leave A Reply Cancel Reply

Recent Posts
  • Has Meta (Facebook) stock seen the bottom
  • What Is The Nearest Technical Support For Meta (NASDAQ: FB)
  • Using Elliott Waves to Capture a Trade in S&P500
  • Hedge Funds and Elliott Waves – Netflix $NFLX
  • When Elliott Waves applauds the promoter’s signals!

WaveTimes is a Research Organization dedicated to providing original analysis, reports, reviews, and insights on developments in mutual funds, stocks, investing, foreign exchange, commodities, and bonds.

Contact WaveTimes

L-601 Mantri Espana,

Kariyammana Agrahara, Bellandur, Bangalore 560103

Follow Us

  • Facebook
  • YouTube
  • Twitter

© 2023 Wave Times. All Rights Reserved.
  • About
  • Books
  • Privacy Policy
  • Policies and Standards

Type above and press Enter to search. Press Esc to cancel.