• About
  • Elliott Waves
    • Elliott Waves Explained
    • Elliott Wave Magic Illustrated with Wave Charts
    • Elliott Wave Edge – How Elliott Wave Traders Win
    • Fibonacci Number Series and Elliott Waves
    • How to use Fibonacci Ratio Retracements
    • Elliott Wave Books
      • The Elliott Wave Book – Five Waves to Financial Freedom
      • Dividend Growth Investing Using Elliott Waves
    • Videos
  • Equities
    • Indices
      • Africa
        • Egypt
      • Australia
      • European Indices
        • AEX – Index, Amsterdam
        • DAX Index
        • Istanbul
        • Russia
        • Spain’s IBEX 35
      • Asian Indices
        • India
        • China
        • Dubai
        • Kuwait
        • Kuala Lumpur
        • Pakistan
        • Saudi
        • Taiwan
      • US Indices
        • S&P500
        • Nasdaq
        • Dow Jones
        • Dow Jones Utilities
    • Stocks
      • Asian Stocks
        • Indian Stocks Trading
        • Dubai Stocks Outlook
        • Japanese Stocks
        • Kuwait stocks
        • Saudi Stocks Outlook
      • African Stocks
        • Egyptian Stocks
      • Swiss Stocks
      • Australian Stocks
      • European Stocks
      • US Stocks outlook
      • UK Stocks
  • Commodities
    • Copper
    • Gasoline
    • Gold
    • Natural Gas
    • Oil
    • Palm Oil
    • Raw Sugar
    • Rubber
    • Soybean Oil
    • Silver
  • Forex
    • AUD
    • Bitcoin
    • CAD
    • CHF
    • Euro
    • GBP
    • INR
    • NZD
    • JPY
  • Raves
  • Consulting
    • Consulting
  • Ramki’s Watchlist
Top News

Has Meta (Facebook) stock seen the bottom

March 21, 2022

What Is The Nearest Technical Support For Meta (NASDAQ: FB)

February 7, 2022

Using Elliott Waves to Capture a Trade in S&P500

January 27, 2022
Facebook Twitter Instagram
WaveTimes Blog WaveTimes Blog
Wave times
  • About
  • Elliott Waves
    • Elliott Waves Explained
    • Elliott Wave Magic Illustrated with Wave Charts
    • Elliott Wave Edge – How Elliott Wave Traders Win
    • Fibonacci Number Series and Elliott Waves
    • How to use Fibonacci Ratio Retracements
    • Elliott Wave Books
      • The Elliott Wave Book – Five Waves to Financial Freedom
      • Dividend Growth Investing Using Elliott Waves
    • Videos
  • Equities
    • Indices
      • Africa
        • Egypt
      • Australia
      • European Indices
        • AEX – Index, Amsterdam
        • DAX Index
        • Istanbul
        • Russia
        • Spain’s IBEX 35
      • Asian Indices
        • India
        • China
        • Dubai
        • Kuwait
        • Kuala Lumpur
        • Pakistan
        • Saudi
        • Taiwan
      • US Indices
        • S&P500
        • Nasdaq
        • Dow Jones
        • Dow Jones Utilities
    • Stocks
      • Asian Stocks
        • Indian Stocks Trading
        • Dubai Stocks Outlook
        • Japanese Stocks
        • Kuwait stocks
        • Saudi Stocks Outlook
      • African Stocks
        • Egyptian Stocks
      • Swiss Stocks
      • Australian Stocks
      • European Stocks
      • US Stocks outlook
      • UK Stocks
  • Commodities
    • Copper
    • Gasoline
    • Gold
    • Natural Gas
    • Oil
    • Palm Oil
    • Raw Sugar
    • Rubber
    • Soybean Oil
    • Silver
  • Forex
    • AUD
    • Bitcoin
    • CAD
    • CHF
    • Euro
    • GBP
    • INR
    • NZD
    • JPY
  • Raves
  • Consulting
    • Consulting
  • Ramki’s Watchlist
WaveTimes Blog WaveTimes Blog
Home » Elliott Wave Analysis of Karachi Stock Index
Pakistan

Elliott Wave Analysis of Karachi Stock Index

RamkiBy RamkiJuly 13, 20137 Comments2 Mins Read
Facebook Twitter LinkedIn Telegram Pinterest Tumblr Reddit WhatsApp Email
Share
Facebook Twitter LinkedIn Pinterest Email

Elliott Wave Analysis can be applied on any well traded market, and that includes the Karachi Stock Index. There are two main indices in Pakistan. One is the KSE30, which I believe comprises of the leading shares. The broader KSE100 index is defined by Wikipedia as follows: Karachi Stock Exchange 100 Index (KSE-100 Index) is a stock index acting as a benchmark to compare prices on the Karachi Stock Exchange (KSE) over a period. In determining representative compaines to compute the index on, companies with the highest market capitalization are selected. However, to ensure full market representation, the company with the highest market capitalization from each sector is also included.

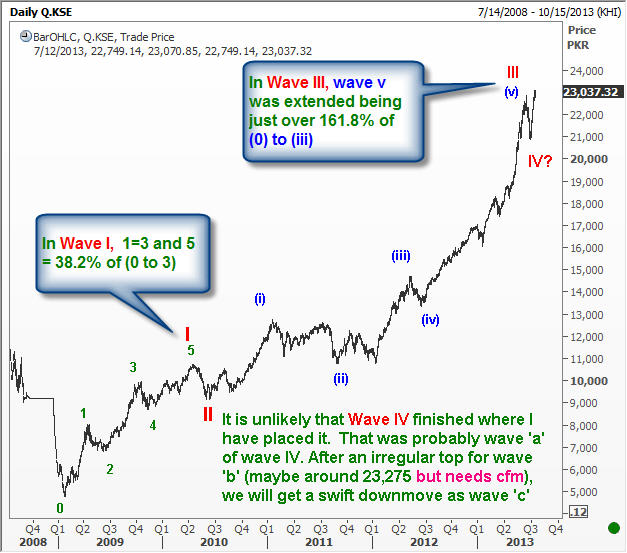
In today’s Elliott Wave update, I am presenting you with the analysis of the KSE100 index. As always, a picture is worth a thousand words. Pertinent Elliott wave comments and wave counts are given on the Elliott Wave chart itself. Remember an important lesson that I have oft repeated in these posts, as well as in my replies to many comments., any analysis is the first step towards making sensible trading decisions. Before you actually risk real money in the markets, you should wait for the right kind of set up that increases the odds for your success significantly. Elliott Waves give you the tools to do that. All the best.

Karachi Stock Index KSE100
Karach Stock Index KSE100 Pakistan Stock Index
Share. Facebook Twitter Pinterest LinkedIn Tumblr Telegram Email
Previous ArticleElliott Wave Analysis of Nifty
Next Article Trading MSFT after Steve Ballmer news
Ramki
  • Website

View 7 Comments

7 Comments

  1. wavetrader on July 13, 2013 3:06 pm

    Dear Ramki Sir,

    I have been following your posts regularly and they have been very useful. Thanks very much. I greatly appreciate your work.
    I would like to use the Thomson Reuters charts you are using. Can you please share the Thomson Reuters link from where I can subscribe to these charts.

    Reply
  2. Piyush Chaudhry on July 13, 2013 10:09 pm

    The count doesn’t seem correct.
    0-2 is piercing through 3. It shouldn’t even touch.
    The larger Red 1 should end where (i) marked in blue is mentioned and larger Red 2 should be placed at the right side of (ii)-blue.
    Going by that, KSE30 is still in larger Red 3.
    Would love to mark the sub-divisions if i could get the levels/data.

    Reply
  3. BK on July 14, 2013 2:34 pm

    Thanks Ramki!

    Reply
  4. Piyush Chaudhry on July 15, 2013 12:00 pm

    Ramki,
    Why don’t you publish any criticism about your analysis??
    If you are good and you think you’re correct, what scares you?
    My comments on this chart were based on merit. I hoped to have a healthy discussion on the same.
    Sorry if it bothered you.

    Reply
    • Ramki Ramakrishnan on July 23, 2013 7:05 pm

      Piyush, Thank you for posting. I dont post my analysis for praise, and anyone is welcome to criticize it if it helps them. This blog is completely free, and has used up many valuable hours of free time. I have always published constructive criticism and I have never deleted any of my wrong calls.

      Reply
  5. Abhay Mehrotra on July 16, 2013 1:56 pm

    Dear Sir ,
    Kindly have a look at my Eliot Wave count of MCX Nickel , If u can spare some time .

    Thanks & Regards
    Abhay Mehrotra

    Reply
    • Ramki Ramakrishnan on July 23, 2013 6:57 pm

      Abhay, My apologies but due to paucity of time I am not able to look at other peoples’ analyses. Good luck with your pursuits

      Reply

Leave A Reply Cancel Reply

Recent Posts
  • Has Meta (Facebook) stock seen the bottom
  • What Is The Nearest Technical Support For Meta (NASDAQ: FB)
  • Using Elliott Waves to Capture a Trade in S&P500
  • Hedge Funds and Elliott Waves – Netflix $NFLX
  • When Elliott Waves applauds the promoter’s signals!

WaveTimes is a Research Organization dedicated to providing original analysis, reports, reviews, and insights on developments in mutual funds, stocks, investing, foreign exchange, commodities, and bonds.

Contact WaveTimes

L-601 Mantri Espana,

Kariyammana Agrahara, Bellandur, Bangalore 560103

Follow Us

  • Facebook
  • YouTube
  • Twitter

© 2023 Wave Times. All Rights Reserved.
  • About
  • Books
  • Privacy Policy
  • Policies and Standards

Type above and press Enter to search. Press Esc to cancel.