Every now and then I get a request to do Elliott Wave Analysis of a new instrument, and this time it is the turn of the IMKB-100, or the benchmark equity index of the Istanbul stock exchange in Turkey.
As regular readers of this blog know, I beleive that you could apply Elliott Waves to any well traded instrument and frequently the result is an eye-opener. I am sure there are thousands of traders in Turkey who are unaware of how they could benefit if they applied even some basic concepts that is explained in WaveTimes. So this post is dedicated to them. Please share.
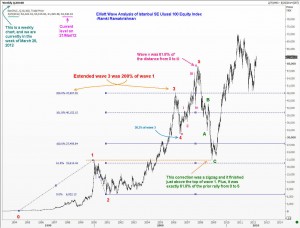
There are two charts that are presented here. The first one is a long-term week chart. You can see how we got a nice five wave rally from the mid 1990s. The third wave was 200% of the first wave. Then we got a 38.2% correction as wave 4, followed by a fifth wave that was itself capable of being broken down into 5 minor waves. The ending point of the fifth wave was predictable using the method I explained in the book ‘Five Waves to Financial Freedom’. If one had gotten out near there, he/she could have escaped a loss of 61.8% in the value of the broad market!
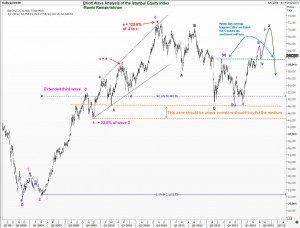
The next chart gives you the details of the new up move that began after the major correction. This is a daily chart, and once again you can see how one could have used Elliott Wave Analysis to benefit.
I have also drawn a tentative path the five waves of the current C wave should travel. Once that move is over, expect a relatively large downmove again to complete a correction of the huge rally we saw from near 20,000 to above 70,000.


