• About
  • Elliott Waves
    • Elliott Waves Explained
    • Elliott Wave Magic Illustrated with Wave Charts
    • Elliott Wave Edge – How Elliott Wave Traders Win
    • Fibonacci Number Series and Elliott Waves
    • How to use Fibonacci Ratio Retracements
    • Elliott Wave Books
      • The Elliott Wave Book – Five Waves to Financial Freedom
      • Dividend Growth Investing Using Elliott Waves
    • Videos
  • Equities
    • Indices
      • Africa
        • Egypt
      • Australia
      • European Indices
        • AEX – Index, Amsterdam
        • DAX Index
        • Istanbul
        • Russia
        • Spain’s IBEX 35
      • Asian Indices
        • India
        • China
        • Dubai
        • Kuwait
        • Kuala Lumpur
        • Pakistan
        • Saudi
        • Taiwan
      • US Indices
        • S&P500
        • Nasdaq
        • Dow Jones
        • Dow Jones Utilities
    • Stocks
      • Asian Stocks
        • Indian Stocks Trading
        • Dubai Stocks Outlook
        • Japanese Stocks
        • Kuwait stocks
        • Saudi Stocks Outlook
      • African Stocks
        • Egyptian Stocks
      • Swiss Stocks
      • Australian Stocks
      • European Stocks
      • US Stocks outlook
      • UK Stocks
  • Commodities
    • Copper
    • Gasoline
    • Gold
    • Natural Gas
    • Oil
    • Palm Oil
    • Raw Sugar
    • Rubber
    • Soybean Oil
    • Silver
  • Forex
    • AUD
    • Bitcoin
    • CAD
    • CHF
    • Euro
    • GBP
    • INR
    • NZD
    • JPY
  • Raves
  • Consulting
    • Consulting
  • Ramki’s Watchlist
Top News

Has Meta (Facebook) stock seen the bottom

March 21, 2022

What Is The Nearest Technical Support For Meta (NASDAQ: FB)

February 7, 2022

Using Elliott Waves to Capture a Trade in S&P500

January 27, 2022
Facebook Twitter Instagram
WaveTimes Blog WaveTimes Blog
Wave times
  • About
  • Elliott Waves
    • Elliott Waves Explained
    • Elliott Wave Magic Illustrated with Wave Charts
    • Elliott Wave Edge – How Elliott Wave Traders Win
    • Fibonacci Number Series and Elliott Waves
    • How to use Fibonacci Ratio Retracements
    • Elliott Wave Books
      • The Elliott Wave Book – Five Waves to Financial Freedom
      • Dividend Growth Investing Using Elliott Waves
    • Videos
  • Equities
    • Indices
      • Africa
        • Egypt
      • Australia
      • European Indices
        • AEX – Index, Amsterdam
        • DAX Index
        • Istanbul
        • Russia
        • Spain’s IBEX 35
      • Asian Indices
        • India
        • China
        • Dubai
        • Kuwait
        • Kuala Lumpur
        • Pakistan
        • Saudi
        • Taiwan
      • US Indices
        • S&P500
        • Nasdaq
        • Dow Jones
        • Dow Jones Utilities
    • Stocks
      • Asian Stocks
        • Indian Stocks Trading
        • Dubai Stocks Outlook
        • Japanese Stocks
        • Kuwait stocks
        • Saudi Stocks Outlook
      • African Stocks
        • Egyptian Stocks
      • Swiss Stocks
      • Australian Stocks
      • European Stocks
      • US Stocks outlook
      • UK Stocks
  • Commodities
    • Copper
    • Gasoline
    • Gold
    • Natural Gas
    • Oil
    • Palm Oil
    • Raw Sugar
    • Rubber
    • Soybean Oil
    • Silver
  • Forex
    • AUD
    • Bitcoin
    • CAD
    • CHF
    • Euro
    • GBP
    • INR
    • NZD
    • JPY
  • Raves
  • Consulting
    • Consulting
  • Ramki’s Watchlist
WaveTimes Blog WaveTimes Blog
Home » Elliott Wave Analysis of India's Sensex
India

Elliott Wave Analysis of India's Sensex

RamkiBy RamkiAugust 8, 20104 Comments1 Min Read
Facebook Twitter LinkedIn Telegram Pinterest Tumblr Reddit WhatsApp Email
Share
Facebook Twitter LinkedIn Pinterest Email

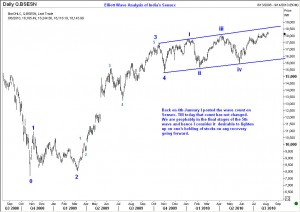
Sometimes a wave count will remain valid for a long time. This is the case with India’s Sensex. I had posted my wave count back on 4th January 2010. At that time, I suggested that we will see the development of a 5th wave that could take us to 18550. The high so far has been 18295. The internal counts of the fifth wave shows its own 5-wave pattern. Hence, we should be cautious about buying here. Indeed, one should look for opportunities to lock in some profits and stay on the sidelines while the next correction takes us down by 38% of the whole rally from 7697 to whatever is going to be the top.

Share. Facebook Twitter Pinterest LinkedIn Tumblr Telegram Email
Previous ArticleElliott Wave Analysis of GBP/USD 8Aug2010
Next Article Medium Term Elliott Wave Analysis of EUR/USD
Ramki
  • Website

Related Posts

How Elliott Waves helped WaveTimes members to exit before the stock market crash

March 27, 2020

How we traded Castrol India using Elliott Waves

December 9, 2019

Nifty rallied up in 5 waves

July 10, 2015
View 4 Comments

4 Comments

  1. Ritesh Mehta on August 9, 2010 2:46 am

    Hi. I am intrigued by your count of Sensex and wish to discuss the ending diagonal pattern that you have marked out. I labelled the ending diagonal iii as 4 wave end and not i see up wave 5 for a final culmination at around 19k to 19.5k levels. Can you throw some more light on your count rationale?

    Reply
    • Ramki on August 9, 2010 5:03 am

      Hello Ritesh, Sorry I can’t make out your count from what you have described. However, if you read my comments of 4th January, perhaps things will be clearer. Besides, the 19k level was always open. More important is what you are going to do with your count. Are you going to be buying here for the move, or or you going to lighten up. The goal of elliott wave analysis is to make money. Also bear in mind that two people can trade the same chart with different counts and both can still make money (or control risk). The only requirement is you are familiar with dealing with Elliott Waves, know the rules, guidelines and wave personalities. Good luck.

      Reply
  2. Manish on August 10, 2010 2:09 am

    Hi,
    i read ur 4th jan post also.there in comments section u have written “Ganesh, The Indian stock markets continue to trade higher, and I won’t be surprised to see 18,600 initially and maybe even 20,550 unless the Central Bank (RBI) does something to dampen enthusiasm.”

    now after seeing this sub waves forming in wave 5 does it indicate that now max is 18550-18600.

    Reply
  3. Ramki on August 11, 2010 11:45 am

    Hello Manish,
    A trader should exit longs as close to 18550 as possible and wait to see what happens there. If it starts coming off quickly, then shorts are warrented with stops above. If it breaks above that level, then one has to reinstate longs on a pull back with a watchful eye on the markets, because we are in any case in the final stages of a 5-wave rally. An experienced wave analyst would never say “Yes, this is going to be the top”. He would be prepared for a top, but always acknowledge that the market is supreme, and we use our tools to give us the so-called ‘edge’.

    Reply

Leave A Reply Cancel Reply

Recent Posts
  • Has Meta (Facebook) stock seen the bottom
  • What Is The Nearest Technical Support For Meta (NASDAQ: FB)
  • Using Elliott Waves to Capture a Trade in S&P500
  • Hedge Funds and Elliott Waves – Netflix $NFLX
  • When Elliott Waves applauds the promoter’s signals!

WaveTimes is a Research Organization dedicated to providing original analysis, reports, reviews, and insights on developments in mutual funds, stocks, investing, foreign exchange, commodities, and bonds.

Contact WaveTimes

L-601 Mantri Espana,

Kariyammana Agrahara, Bellandur, Bangalore 560103

Follow Us

  • Facebook
  • YouTube
  • Twitter

© 2023 Wave Times. All Rights Reserved.
  • About
  • Books
  • Privacy Policy
  • Policies and Standards

Type above and press Enter to search. Press Esc to cancel.