Over the last four years or so, this blog has been presenting you with Elliott Wave Analysis of various instruments in a variety of markets. I have shared with you veritably a treasure trove of information, and have spent countless hours answering innumerable questions from young and experienced traders alike. All this went on despite having the responsibility of running the treasury of a bank. Whether I was at an airport waiting to board a flight, or by the seaside with my kids, I cared enough to give you freely of my time. So it was a great pleasure to see the spontaneous response from readers when I finally launched a paid service where I will share my trade ideas. Thank you very much. Some of you might be disappointed because I have pitched the price relatively high. I did that for a reason. I really wish to keep the number of members there manageable. Secondly, that service is meant for traders who are willing to be patient for the right kind of set ups. There is a bunch of people out there dishing out trading advice every day, and sometimes several times a day for much less. I don’t belong there, neither do members of our exclusive club. Having said all this, I wish to reassure you that this blog will continue to stay alive, because I have promised you that this is a ‘living book’ – an extension of “Five Waves to Financial Freedom”. However, you won’t find as many updates as before because of increasing demands at work and elsewhere for my time.
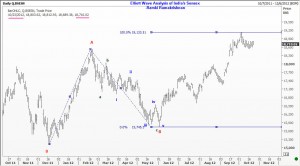
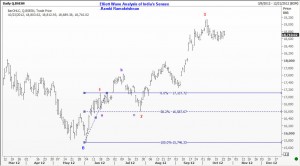
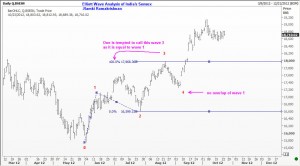
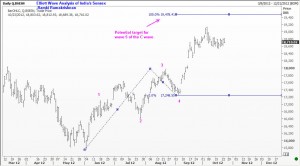
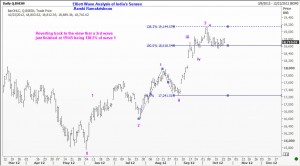
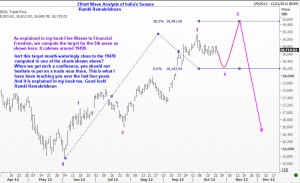
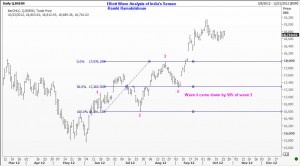
For many weeks now there have been numerous requests for Elliott Wave Analysis of India’s stock indices. Following the recent flash crash on the Nifty, that chart is screwed up. The exchange has refused to fix the price, even though the trades were cancelled. So I am turning my attention to the Sensex index. There are some interesting things to be noted in the following six charts. I would urge you to study each one of them carefully and see if you can follow how I think about these patterns. I don’t exclude anything. I approach the markets with an open mind, always aware that I could be wrong. I start off with an idea, a hypothesis. I look for additional clues that validate the hypothesis, and then decide where to get into the market. In this blog, I have repeatedly said that I am not offering any trading advice. You come here only to learn. Yet, the hypotheses are there, and if you were alert enough, you could have taken numerous low-risk trades that turned out to be extremely profitable. True, some ideas turned out to be wrong. But that risk is always there. A sound knowledge of Elliott Waves would allow you to choose very low risk entry points and this is why so many of you are attracted to learn it. Enough! Time to look at the charts. As always, there is more on the chart than here. Enjoy and share with others. Ramki.
98 Comments
hihi Dott.
you are the best… good luck!!!
cheers
__luca
Luca, thank you
Sir,
The trades mentioned were not cancelled by the exchange . You can look at Nifty futures chart to support & cross check your views on Sensex .
Vidhan
Vidhan, thanks..I thought I had read somewhere that the trades were cancelled. Will correct the post.
Dear Ramki, Trust that u r doing well, its good to see you back in action on Indian index.
My only query on that is, in book its mentioned that 3rd wave wont be taken as normal unless its least 161% of wave 1, in such case the target of wave 5 should come equal to wave 3 or 100% of wave 1 to 3.
Pls clear my doubt. Also looking to forward to get your paid service as soon as pal gate get sorted out.
Thanks
Best Regards
Jaspal Singh
Hi Jaspal, many people read m book multiple times so they will completely understand what s discussed. You should do so too. I didn’t say what you think I did about 3rd waves. Third waves cannot be the smallest. If. Third wave goes more than 161.8 % of first then it is probably extending. Upto 161.8 it is normal.
Hi Ramki,
Thanks for the update and many congratulations for your new venture. Just a suggestions: Is it possible that whenever your paid trade advice runs it course (i.e. trade is executed and profit/loss is taken off the table), can you please post the same at wavetimes.com as well as doing so would not only stonewall the preferential treatment for paid subscribers but would also allow learners like me to look at trade setups and more examples of EW. So essentially, we get to learn and paid subscribers get to play and win.
Cheers
RS
RS, thanks for the suggestion. I had already planned to do so!
Thanks a bunch !
Ramki,
That also provides us with opportunity to anticipate the next trade setup.
thanks!
thankz for your veluable post..after a long time period..
Ritesh, my pleasure
Sir,
Iam a student , have been tring to learn EW from a past few months.Have learnt quite a few concepts about it, but i am struggling to understand how Fibonacci no. are used in practical world.please suggest a good source for learning it.
Hi Paras. There are many good books in the market. Bob prechter’s book is a standard text book. You could also consider another book written by a person called Ramki Ramakrishnan 🙂
Hi,
Ramki,
Pleasure to read your book..really a good one…I read your older posts in this blog, to understand your line of analysis.In my earlier days i am afraid to read EW, as books in market are all a complicates ones, but in your case, the flow of book is so good and pleasant to understand…
God Bless You…Wish you best luck in your future endeavour…
Sir,
Plz S&P 500 updated for currant lavel
According to my analysis S&P 500 completed a wave 4 just above 1400 ,e mini 1394.
it has likely started wave 5 that should end above 1500
Dear Ramki,
Will we get enough posts purely on Indian Market in the paid site….
Rajesh, I have no idea. If I see something offering extraordinary value I will present it to our exclusive members
Dear Sir,
timely up date ! sensex is in sideways mode , of course correcting , may be time wise correction going on because price wise erosion is not seen much . we are in range of 18550 to 18850…….
Thanks sir. please update your views on major change in basic wave count considered if time permits .
really excellent analysis!
regards ,
Pankaj Shah
Earlier you marked the high in Feb as an expanded flat [correct me] If we stick with that then an X wave down followed and another 3 waves up [Y] is complete Then a 5th wave up is not needed.
Rohit, all wave counts are work in progress. We should stick to a count while trading something so we will know when we are wrong. But when I return to a chart after several weeks, I have the flexibility of starting afresh, just like someone who is looking at a new trade altogether. The old count is now history.
My Dear Ramki Sir
nice to see that you start an advisory service. i wish you best of luck. same as some of the readers, i would love to see the trades suggested for subscribers, so that we can learn more ‘acute’ a trade setup. subscribing for a service is just fine, but it may not teach me and make me independent with self-confidence. you have done a good lot of teaching which i appreciate from the core of my heart.
regards
Parimal
Dear Sir,
Pleasure to have your views on Indian Indices. But I Dont think Sensex again will make new high. I think top in place. Every analyst is looking for new high in sensex and probably the same count but its market behavior it has to behave in different manner if most of the people looks for same thing.
I think C is over and downside 1 has completed and consolidation is 2 of new downtrend. Its clearly a distribution not accumulation.
Sir, u hv made EW look so simple & easy to understand.Thanks a million
Rgds
Sunil
Irrespective of the flash crash in Nifty, I’m taking a call on the downside to 5400 levels. My reasoning is two folds. Wave 2 was a simple correction so wave 4 invariably happens to be a complex correction. And it seems to be taking that kind of an A-B-C form. (This was a lesson I learnt via Wave Times). The second reason is the Sep14,2012 gap left unfilled.
That’s how I see the markets in the coming days.
Chart is Nifty Daily:
http://img826.imageshack.us/img826/2770/nifty6100nov03.png
ramki sir i wanted to learn time analysis technique from where can i ??
Luca, even Ralph Elliott found time analysis a challenge. If you get the price angle right you will be very successful
sir somtimes i get the price angle right but the time analysis always goes wrong really need ur help sir..
HI Luca, Even Ralph Elliott found it hard to master time, so why bother?
interesting sub waves !
a) 18973 to 18783 fall of 190 points
b) 18783 to 18894 rise of 111 points
c) 18894 to 18607 fall of 287 points
b = apprx 61% of a
c = 1.5 x a
c = 2.61 x b
have we completed correction at today’s low at 18607 which is near gap support zone at 18590
moreover fall from 18973 to 18607 = 366 points is apprx 61% of rise from 18393 to 18973 = 580 points.
close above 18850 or below 18550 will give strong move,i am optimistic on crossing 18850……….
Hi Ramki,
First of all, I want to thank you for writing a great book. I have been reading for couple of months, already read it 5 or 6 times cover to cover. And I have to say my trading experience has been more enjoyable now. My entry/exit point in trades are well defined now, I still have to work on my execution though, specially on extended waves.
I have an off topic question here from your book. I hope you would find time to answer it. In book, it says one or two waves have tendencies to be extended. If wave 3 or 5 does not go beyond 1.61 from wave 1, those waves are called normal waves(not extended). How would you characterize a wave if it just goes beyond 1.61 by a few points, say 1.7 of Wave 1? Is it normal or extended?
Hi Vinay
After a while it all comes down to making a judgmental call. Exceeding by just a few points will usually not be considered an extension. Good luck.
Dear Sir,
sensex has tested 18255 which is quite closer to your target for end of sub wave 4. seems market is following path defined by you .
we have seen good reversal from 18255 and today we have moved 18800+.
have we completed sub wave 4 and we are on the final sub wave 5 for target around 19500 ?
we are very close to trend line connecting 19137 & 18973.
your views please ?
Pankaj Shah
Ramki,
I get a potential target of 19550 approx.
Wave 1: 157480-17109
Wave 2: 17109-16559
Wave 3: 16559-19145
Wave 4: 19145-18256
Wave 5: 18256-????
Wave 0-3 distance *0.382 equals 1297 added to 18256 gives me 19550 approx. So wave 5 could end around 19550?
Srinivasan, you need to look at the sub waves of the fifth to determine likely end points
Dear Ramki,
As per your book.
If wave-3 finished upto@161.8% it is normal wave.
and wave-3 finished at @138.2% @ 19137.
So can we assume that wave-5 will be extended up t019900-20000.???
Prithvi, you are a fast learner
Your sensex forecast 19490. We are almost there ….Sensex touched 19372.
VD, allow an overshoot to 19820
SIR, what should be STOP LOSS above 19820 ?
ASC, PLease bear in mind that posts that appear on WaveTimes are not trade recommendations!
Dear Sir,
If possible can you give update on Sensex again.
Many of us really need your guidance ……………
Abhinav, of course! It is still not over on the upside, although the bulls are tiring.
Hello Mr.Ramakrishnan,
Are you planning to revise IMKB 100 analysıs shortly
Thnx
Bulent, I will try, but 74000 is now a good support area and continue to play on the long side by buying decent corrections
Dear Ramki Sir,
did we complete up move from 15748 today at 19612 ?
18255 to 19612 is 1357 which is apprx 1.382 of 15748 to 19137.
sub wave 5 ended at 19612 at today’s high?
or
did we complete up move from 16598 today at 19612?
sub wave 1 : 15748 to 17631 ( 1883 )
sub wave 2 : 17631 to 16598 ( 1033 )
sub wave 3 : 16598 to 19612 (3014 ) which is 1.618 of sub wave 1.
to be followed by sub wave 4 down and sub wave 5 up to complete upmove which has started at 15135?
Regards,
Pankaj Shah
Pankaj, please read my response to the question raised by Prithvi.
Dear Ramki ,
Please take a look again on Sensex,
The count is like ,
Sensex
From To point
Wave-1 15749 17109 1360 100%
Wave-2 17109 16598 511 38.20%
Wave-3 16598 19137 2539 138.20%
Wave-4 19137 18256 881
Wave-5 18256 19616 1360 38.2% 19550
or Extended 20354 61.80%
NSEI
From To point
Wave-1 4770 5190 420 100%
Wave-2 5190 5032 158 38.20%
Wave-3 5032 5815 783 200%apx.
Wave-4 5815 5548 267 38.2% apx.
Wave-5 5548 5968 420 38.20%
wave-5 normal bcz wave-3 extended.
In both case result comes diffrent.
NSEI now finished wave-5 and sensex have some more point.
But both are our index ,so if NSEI crash than Sensex also crash.
and ,if Sensex going up than NSEI also going up
What to do…….
Please clarify me
Regards,
Prithvi
Prithvi
Thank you for writing. You must excuse me, but I am unable to review wave counts posted by others. There are as many counts possible as there are readers! Stick to your own count till you are proved wrong. That is my best advice.
Ramki sir,
Is it true we have got the top or will be getting top of Sensex this month for next 15 -18 months…Do Elliot wave has the power to tell whether May Election gap(12000) will be filled or not,…in next 18 months..??
Or we are moving towards 34000 and have entered in bull market due to change in Wave structure…?????
Sameer, a top may not be far off. Whether that top is temporary, or whether it will take us down to 12000 are questions one can honestly answer only as the moves unfold. The markets are dynamic. I suggest that you read my post on Home Depot today (27 Dec 2012) and you can see how the markets changed after I thought a top was in place. But that doesn’t mean I should give up EWP. It is not my mistake, but the market is dynamic, New information comes, and wave counts change. In the long run we are all dead. In the short run, you could make many profitable trades. If you are a long term player like Warren Buffet, then you should never sell your blue chips.
sir
is this wave c or wave iii?
pl guide.
Salim, I dont know what levels you are referring to. In order to make money, you just need to know where the C wave or 3rd wave is likely to end, and then go the opposite way. If you are a longer term player, look at the big picture, weekly chart, and you can easily figure out of it is a C wave or 3rd wave.
Dear Ramki Sir
kindly educate me as regards Reflex Point- pg.72 of your book). Should it occur always at the bottom of the chart to make a valid one or it can take place at the middle of the chart to carry weight.
thanks and regards
Parimal, A reflex point can happen in any degree; and the results will depend on how you interpret it. Suggest you read that section carefully again and am sure it will become clear. Good luck
I think today it has started to fall. Pl. elaborate.
Rajesh, you may be right, but I think any weakness will be reclaimed as the bulls are weakened but not dead
Sir..is it possible that 5 waves ended at yr given target ie at 1=5 and downmove started??
Anuj, anything is possible, but I think we need some more top building work before down.
Hi Ramki,
Its been a long time since you posted EWA. Are you on New year holiday?
HI Sandy, yes I was away on a holiday. Glad you remembered me!
Dear sir,
any change in your view, still u believe it will reach high of 19800 or the top has reached already and it will fall down.
Hi Raman,
You have the tools in your hands! My earlier analysis shows the way and you can try and fine tune it yourself. Good luck.
Dear Ramki Sir
thanks for your very kind answer. it is a great support. i shall read that chapter many more times.
very kind regards. wishing you very good health and high spirit.
Parimal.
Wish you all a very happy new yr.
Hi ramki sir
the way nifty and sensex are moving up it seems the bulls are tiring should we take it as a signal that the top is near and if so how many months does it usually take for the topping pattern to form before the down move starts
Hi Akhil, there are no set rules about the time it will take to establish a topping pattern.
Dear Ramki Sir,
week starting from 7th jan, 2013 will be 55th week from last major bottom .tentative target around 19800 is achieved. can we see some topping formation in coming week?
Pankaj Shah
Pankaj , it is still too soon to call a top
broader market made top in week started from 7th jan, mid cap and small cap indices made tops . sensex made high of 20204 on 29th jan.
yr updates sir?
we have come down from 20204 to 19300 so far……..
Dear Sir Ramki
a) You have a full time job as a treasury manager,
b) You scan and trace a large number of markets and stocks across the globe and also present technical views on them, which consumes considerable time,
c) You have now started advisory services which is highly demanding a job,
d) You conduct seminars on EWP in various parts of the world,
e) You give reply to a host of queries on technical issues shot on your blog as well as new website, —
My Dear Sir,
May GOD give you good health and longevity!!!
All the best!
Parimal, Thanks for your comments.
Dear Ramki
At what level can we expect a confirmation that the top is in for Sensex. You had mentioned 19800 as the region to watch out and we topped at 19856 and have corrected a bit since. Personally i would prefer the high of 20674 to be the topping region but we cant predict the market and follow what its telling us. So may be a little light on the region beyond which we should be looking to short the rallies would really come in helpful.
Hi Prateek, trying to catch the top will work if you are wiling to do the following (a) do your analysis properly and identify the upcoming top by looking at minor waves (b) place an order before it reaches there and (c) be willing to lose money should the market sail past your stops. For everyone else, the better way to trade is to allow a five wave move down past the Reflex Point (see my book) and sell on a recovery. This is HOW TO TRADE. If you are looking for HOW TO PREDICT TOPS TO TELL OTHERS, then please read my book carefully.
Ramki sir
This is the count on the basis of which i was looking at a top around 20674 in sensex and 6194 for nifty as it is the region where standard TA also points as a mojor resistance
1. Wave 1 – 4770-5348 = 578. 5548+578 = 6126
2. Wave 1-3 – 4770-5815 = 1045
a. 1045*0.382+5548 = 5948 (Already Done)
b. 1045*0.618+5548 = 6194
Hi,
Ramki Sir,
Its nice to see ur comments and ur valuable analysis from time to time.
Thanks for the analysis
regards
Sir any latest update on sensex….
My Dear Ramki Sir
this is something truly wonderful that you are doing, posting the trade details meant for the subscribers. this creates great opportunity for learning EWP. thanks your great heart and generosity.
All the best.
Parimal, You are welcome. But not every trade will be posted here because I dont have so much free time…
Nifty made high of 6042 and the same day it has shown bearish engulfing pattern. I expect correction about 5830.
Prateek,
The wave counts do not indicate an extension in 3 or in 5. Atleast one impulse should have an extension.
Srinivasan.
It seems correction started.Could you please update us for the same?If correction started how far can it go?Your views please.
@All,
All missed rally from 4800 to 6100,
bcz tgt in mind that 4400.
hahahaha
now look for 6400-6500 not for again 4400.
Hi Prithvi, thanks for sharing that experience. It is a very valuable lesson that others can learn from. When you do some analysis, and it tells you the stock can go to say 4400, it will be a disaster from a trader’s point of view to stick with that forever. First of all, one should understand WHY he/she is doing the analysis. I hope it is not to show off to friends how good one is in counting, because that is a complete waste of time. No one cares two hoots whether another person’s count is right or wrong. All that matters is whether money can be made while keeping risk low. If you are analyzing the market to trade, then you will know very quickly where you are going wrong, if you understand how Elliott Waves helps you. From that moment, you start with a new count. So if I write on this blog about Nifty, for example, it is not to seek fame or approval. It is with an intention to illustrate the concept, and I don’t cover up my mistakes by removing counts that go wrong. My opinion is EVERY SINGLE COUNT of mine will be wrong sooner or later! If some worked for longer, that is terrific. Other counts have failed almost the next day. Prithvi, I thank you again for this fantastic comment you made.
Sir,
Greetings from Kolkata!
The last thing you talked about during your Kolkata visit was your prediction of a fall in the Sensex. Congratulations! it worked out beautifully well.
What do you feel about the market now. It has been long since we hear about the Indian markets from you.
Cheers!!!
Request an update. My own wave count seems to suggest that we should start a decline again but the strength of the move up in the last two weeks has put some doubts in my mind.
Gaurav, Let the move be finished, perhaps near prior high. Join in when you get evidence of a top in place. You may not get the highest high to sell, but you wont also take needless risks
A possible count on Nifty is given here http://img35.imageshack.us/img35/3283/niftymay042013wayforwar.png
The down move which started from 6115 in the end of Jan 2013 and reached the low of 5476 has negated any bullish count starting from the lows 4534 in oct 2011, we can’t label it as impulsive wave, simply because of the overlap, unless of course the 3rd wave itself is subdividing and we are witnessing the 3rd of 3rd which implies super bullish trend.
My above count and views are based on bearish bias.
Sir, couple of post back we had a discussion on 3rd of 3rd wave. Here again we have a possibility on Nifty, if we assume that an impulsive move began from 4534 in Oct 2011 we are done with W1 and W2 and W3 is on which is subdividing hence the overlap. You had indicated then that once it move past the high wave 3 is extending.
Since both wave C and wave 3 have same characteristics i .e. fast moves. My question is how to distinguish between extending wave 3 and a terminating wave C
as appears by my counts on the charts ? or I am totally off the mark ?
Rainmaker, either we are in a big B wave, or we will develop into a diagonal triangle in the fifth wave position. Let us see. In order to determine whether it is a third wave or C wave, go to the bigger picture and count waves again.
Dear Ramki,
Can you just labelled the wave count on chart so as we understand latest possibility.
Regards,
Pinakin
Sir
I wanted to ask in the labelling of waves can we use degrees like daily, weekly, monthly, quatrly, yearly and multiyear for our labelling
regards
chandan
Hi Candran, let us suppose you are looking at a daily chart of a stock. You might see it is in a second wave. But if you look at the five minute charts, you might see you are in a Fourth wave within the C wave. This is an example of degrees, not the periodicity
Hello Ramki Sir,
While calculating values for Fib ratios,how much approximation is acceptable.Does it always needs to be absolute or some some sort of variance is acceptable.How many points (plus,minus) you take into consideration for approximation or variance levels which is acceptable.
Prabh, bear in mind that the markets are not machines. Hence they need not necessarily stop at the exact fib targets. How much extra room to give it is a judgement call. But it shouldn’t be too much:)
Many Thanks.Much appreciated.
sir
nifty is at crucial level n we eagerly waiting for ur valuable guidance.
pl share
thanks