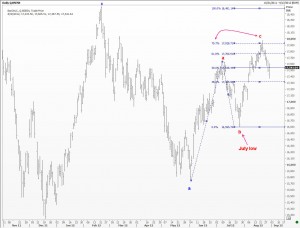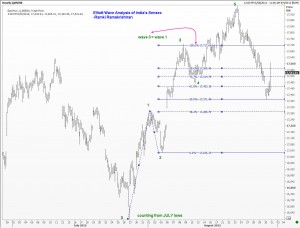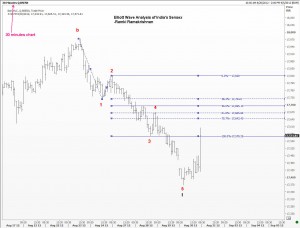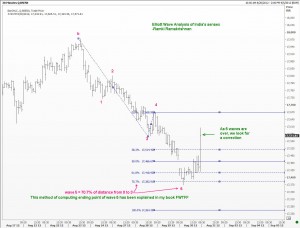


 When we know that we are in the midst of a complex correction, we should expect the unexpected! India’s stock indices are a clear example. I have posted a few times about the NIFTY. Here is a look at the Sensex for a change. Elliott Wave and Fibonacci relationships abound. I have only shown you some of the main ones here in the BSE charts. Today’s post is to be used as a learning experience. One clue for you: I have shown the July low prominently in some of the charts. The reason is when we finish witha 5-wave pattern up, and then immediately get a new 5-wave pattern down, the implications are very suggestive. Enjoy.
Elliott Wave Analysis of India’s Sensex BSE Index

Unleash your Potential
Transform your trading – Starting Today
