Now that the Parliamentary elections are over in India, and a decisive mandate has been given to the Congress party and its allies to continue in power, most people expect the stock market to react positively. Let us take a look at three Indian stocks from an Elliot Wave Analysis perspective, and see where they can go in the near term.
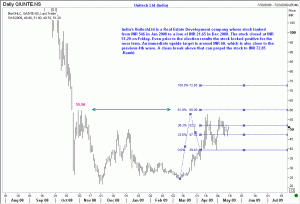
The first stock we look at is Unitech Ltd. This is a real estate development company whose stock tanked from Rs 546 to a mere Rs 22 within the space of one year. After an initial rally to around Rs50, we got a deep correction down and a fresh recovery has taken the stock higher again. We closed at Rs51.20 last week, but there are still some positive signs. If we can break above Rs60, Elliott Wave analysis would suggest continuation of the rally towards Rs73. Next let us examine the chart of Tata Steel Ltd.

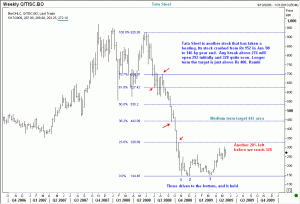
This chart shows how severe the sell-off has been since Jan 2008. The stock was decimated from 926 to just 145. We have another 20% at least left on the upside where the first resistance at the 23.6% retracement level lies (at Rs328). In the bigger picture, Elliott Wave Analysis suggests that a move to between 410 and 443 remains possible, and hence one should consider adding to longs if we get a decent correction.
Our last Indian stock today is Larsen & Toubro.

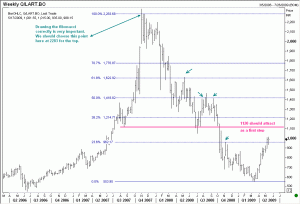
In a recent post, I highlighted the importance of correctly drawing the Fibonacci grid. The chart you see here is another example of how one should ignore spikes while drawing Fibonacci retracements. Although the 38.2% retracement level lies at Rs1214, we should be careful near 1120, which acted as a pressure point in the past.

