 Even if you have no interest in trading INdian stocks, you have something to learn from these posts!
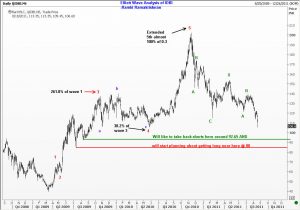
Sometimes, a chart almost screams out a sell, and IDBI was one such stock back near the highs. (Rememebr my video on TCS and stubborn bearish calls despite all the good news that was coming out then? Well, this is quite a similar story).
Elliott Wave Analysis of IDBI, a stock that trades on NSEI, would have given you tremendous confidence to be short near the highs and to hold on to you position for the great run to the downside that we are still experiencing. The stock has approached a short term support here, (being near a prior 4th wave) but any recovery is going to be short lived, as we will almost certainly continue down to the INR 93 levels. Use any recovery towards 112.50-00 levels to sell and sit tight for a few sessions. (stop above 114) and you should be smiling afterwards. Good luck.

