• About
  • Elliott Waves
    • Elliott Waves Explained
    • Elliott Wave Magic Illustrated with Wave Charts
    • Elliott Wave Edge – How Elliott Wave Traders Win
    • Fibonacci Number Series and Elliott Waves
    • How to use Fibonacci Ratio Retracements
    • Elliott Wave Books
      • The Elliott Wave Book – Five Waves to Financial Freedom
      • Dividend Growth Investing Using Elliott Waves
    • Videos
  • Equities
    • Indices
      • Africa
        • Egypt
      • Australia
      • European Indices
        • AEX – Index, Amsterdam
        • DAX Index
        • Istanbul
        • Russia
        • Spain’s IBEX 35
      • Asian Indices
        • India
        • China
        • Dubai
        • Kuwait
        • Kuala Lumpur
        • Pakistan
        • Saudi
        • Taiwan
      • US Indices
        • S&P500
        • Nasdaq
        • Dow Jones
        • Dow Jones Utilities
    • Stocks
      • Asian Stocks
        • Indian Stocks Trading
        • Dubai Stocks Outlook
        • Japanese Stocks
        • Kuwait stocks
        • Saudi Stocks Outlook
      • African Stocks
        • Egyptian Stocks
      • Swiss Stocks
      • Australian Stocks
      • European Stocks
      • US Stocks outlook
      • UK Stocks
  • Commodities
    • Copper
    • Gasoline
    • Gold
    • Natural Gas
    • Oil
    • Palm Oil
    • Raw Sugar
    • Rubber
    • Soybean Oil
    • Silver
  • Forex
    • AUD
    • Bitcoin
    • CAD
    • CHF
    • Euro
    • GBP
    • INR
    • NZD
    • JPY
  • Raves
  • Consulting
    • Consulting
  • Ramki’s Watchlist
Top News

Has Meta (Facebook) stock seen the bottom

March 21, 2022

What Is The Nearest Technical Support For Meta (NASDAQ: FB)

February 7, 2022

Using Elliott Waves to Capture a Trade in S&P500

January 27, 2022
Facebook Twitter Instagram
WaveTimes Blog WaveTimes Blog
Wave times
  • About
  • Elliott Waves
    • Elliott Waves Explained
    • Elliott Wave Magic Illustrated with Wave Charts
    • Elliott Wave Edge – How Elliott Wave Traders Win
    • Fibonacci Number Series and Elliott Waves
    • How to use Fibonacci Ratio Retracements
    • Elliott Wave Books
      • The Elliott Wave Book – Five Waves to Financial Freedom
      • Dividend Growth Investing Using Elliott Waves
    • Videos
  • Equities
    • Indices
      • Africa
        • Egypt
      • Australia
      • European Indices
        • AEX – Index, Amsterdam
        • DAX Index
        • Istanbul
        • Russia
        • Spain’s IBEX 35
      • Asian Indices
        • India
        • China
        • Dubai
        • Kuwait
        • Kuala Lumpur
        • Pakistan
        • Saudi
        • Taiwan
      • US Indices
        • S&P500
        • Nasdaq
        • Dow Jones
        • Dow Jones Utilities
    • Stocks
      • Asian Stocks
        • Indian Stocks Trading
        • Dubai Stocks Outlook
        • Japanese Stocks
        • Kuwait stocks
        • Saudi Stocks Outlook
      • African Stocks
        • Egyptian Stocks
      • Swiss Stocks
      • Australian Stocks
      • European Stocks
      • US Stocks outlook
      • UK Stocks
  • Commodities
    • Copper
    • Gasoline
    • Gold
    • Natural Gas
    • Oil
    • Palm Oil
    • Raw Sugar
    • Rubber
    • Soybean Oil
    • Silver
  • Forex
    • AUD
    • Bitcoin
    • CAD
    • CHF
    • Euro
    • GBP
    • INR
    • NZD
    • JPY
  • Raves
  • Consulting
    • Consulting
  • Ramki’s Watchlist
WaveTimes Blog WaveTimes Blog
Home » Elliott Wave Analysis of Gold after sharp downmove
Gold

Elliott Wave Analysis of Gold after sharp downmove

RamkiBy RamkiSeptember 25, 201123 Comments2 Mins Read
Facebook Twitter LinkedIn Telegram Pinterest Tumblr Reddit WhatsApp Email
Share
Facebook Twitter LinkedIn Pinterest Email

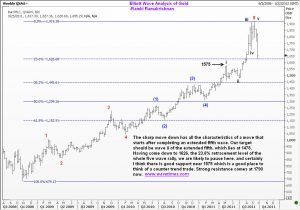
Elliott Wave Count for GoldThe sharp move down has all the characteristics of a move that starts after completing an extended fifth wave. Our target should be wave ii of the extended fifth, which lies at 1478. Having come down to 1626, the 23.6% retracement level of the whole five wave rally, we are likely to pause here, and certainly I think there is good support near 1575 which is a good place to think of a counter trend trade. Strong resistance comes at 1790 now.

It might be helpful for some to consider why I was reluctant to confirm a top in Gold was in place at 1920. This is explained in the post of Sep 8th. My approach to trading is to be exposed when the risk of error is low. A conservative approach would make us miss some very nice moves like what just happened. That is the price of survival! It does seem now that the move to 1920 was not 3 waves, but a five-wave affair. See the hourly chart to the right. Every now and then, we will witness situations where it is possible to count waves differently, and both scenarios appear equally appealing. When we reach such a ‘fork-in-the -road’ it is best to find a shady spot and rest while we wait for someone who knows the road to tell us which way to go.
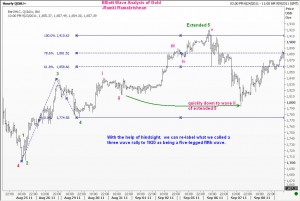
This someone is usually an armchair analyst who doesn’t trade, but made the right call and so wishes to publicize that fact. (Someone who traded and lost money will not tell others, and an experienced trader who made money knows that his next trade could be wrong, and anyway he doesn’t care for being right. He only wants to have good trades, and so he will not tell us). But the best teacher is the market itself. If we arm ourselves with sufficient knowledge of the Elliott Wave Principle, we can make adjustments to our count, and get ready to trade the next move with low risk! That should be our goal, and it is the mission of Wave Times to help you acquire that knowledge and skill set. Good luck all.

If you appreciate what I have explained here, share with your friends. It is a great way to show you care!

commodity Gold metal Ramki
Share. Facebook Twitter Pinterest LinkedIn Tumblr Telegram Email
Previous ArticleElliott Wave Analysis of Richemont
Next Article Elliott Wave analysis of Copper
Ramki
  • Website

Related Posts

Elliott Wave analysis benefits a short term trader in XAU/USD

June 9, 2017

Trading NIFTY using Elliott Waves by Ramki of Wavetimes.com

October 23, 2013

Elliott Wave Analysis of Gold

April 16, 2013
View 23 Comments

23 Comments

  1. rajesh on September 25, 2011 2:45 am

    ramki….thank you.you are truly a wave genius.lease give your insight on nifty ans where is silver bottom

    Reply
  2. Rajeev Juneja on September 25, 2011 2:54 am

    Thanks for your wonderful update on the latest position on Gold. And yes I love these words the most…”When we reach such a ‘fork-in-the -road’ it is best to find a shady spot and rest while we wait for someone who knows the road to tell us which way to go.” Thanks Ramki Sir and God Bless you.Best Regards.

    Reply
  3. Yan on September 25, 2011 3:29 am

    Thanks for the update Sir, I have learned something new today from your analysis.

    Reply
  4. Mani on September 25, 2011 4:52 am

    Again good education on EW sir……………

    Reply
  5. nadir on September 25, 2011 8:32 am

    hello mr. ramki, is a long term low more likely to be established at your black wave ii target or blue wave (2). you have an extension within an extension so im not sure which target is more valid? i’m trying to find a reasonable level to buy some gold. regards, nadir

    Reply
    • Ramki on September 25, 2011 8:39 am

      Nadir, I think it will pay for you to wait till we reach the support I mentioned in my latest post.

      Reply
  6. Fahad on September 25, 2011 10:37 am

    thank you Ramki,

    its still hard to me to cathc the top of extended five wave or at least whats the best position to sell at?

    Reply
    • Ramki on September 25, 2011 12:18 pm

      Farad, trust me, it is never easy to catch the top. Even when you do, you are still doubting yourself! In the final analysis, we hav to trust our judgement and pull the trigger, always having a stop!

      Reply
  7. bdkroo on September 25, 2011 7:13 pm

    Greetings. Have appreciated your analysis–very insightful. And thanks for reminding about Sept 8th post. Are you suggesting a long term top at $1920? Any thoughts on what would confirm/negate this count?

    Reply
  8. Sathya Kumar on September 25, 2011 8:32 pm

    Hi Ramki,

    Thanks for sharing your views. You are really great.

    Thanks
    Sathya

    Reply
  9. harsh dixit on September 25, 2011 10:12 pm

    dear sir ,thanx for yaour update.in longer time gold have a extended 5 th wave ,it mean gold once again comes to 1155 . where 2nd wave of large extended 5th. pls tell me if i am right.

    Reply
    • RainMaker on September 25, 2011 11:31 pm

      Harsh,

      Ramki has clarified above that we must first concentrate on the level 1478 which infact is the present target being wave ii of extended 5 within extended 5th.

      The next target can be wave 4 which coincides with 50% retracement and below that wave (2) of the extended 5 which also happens to be 61.8% retracement, almost 1193 as suggested by you.

      But for now one level at a time.

      Reply
  10. Sunny on September 26, 2011 2:48 am

    Dear Ramki,
    This post(which i liked the most thus far…no not because its on gold) is an example of what makes Wavetimes different from other noisy blogs/views where you hardly find any useful lesson that you can takeaway or learn from a post that you can remember for a long time if not for ever.
    Blind trading equivalent to gambling(we all know that it is to a large extent) and while getting good cards in this game is one step(you need a bit of luck here), “our decision” as to when to take a hit, or when to withdraw or standby from the game is what makes us different from the larger crowd, which enhances our changes of success(luck doesn’t always favor every time). You are truly helping us in enhancing this decision power in true elliott wave sense-taking shots when you tend to get a higher degree of confidence on where the target is going to move next rather than shooting in dark 🙂

    PS: I have loaned(bought) your wisdom(the book) and have started learning(reading) through it, so the sail is ON….

    Best wishes,
    Sunny

    Reply
    • Ramki on September 26, 2011 3:05 am

      HI Sunny, thanks for the comments. Would you consider writing a review on Amazon for me?

      Reply
  11. Bob D on September 26, 2011 11:12 am

    Hello Ramki, I’m wondering how the price action in Gold (since July) affects the previous suggestion of yours that Gold would/could retrace it’s fifth wave extension and return to approx $1155? No longer applicable?

    Reply
    • Ramki on September 28, 2011 5:26 am

      Hi Bob, It all depends on what your count is for the five waves from 680. If you think the extended fifth started from 1044, and you count the wave ii of the fifth to be at 1156, then we will eventually get there! You will observe a certain harmony between all the internal waves, and sometimes you could be excused for labelling a wave incorrectly because of a perceived fibonacci relationship. I prefer to take this one step at a time.

      Reply
      • nadir on September 30, 2011 6:03 pm

        this correction will have to be a zigzag to reach 1156. using your method of calculating targets i can estimate current wave A on the daily chart will end just below 1500 (1494?) assuming wave 4 will end at 1734… worst case B retraces 61.8% of A. from that point, all we need is (138% of A) wave C to reach the wave ii target. regards, nadir

        Reply
  12. Jitendra on October 5, 2011 9:07 pm

    Dear Sir
    I have purchased your book .Its very nice really very good wealth for me.My Question Is it possible that gold could move up from 1642 towards 1740-1750 I Captured a triangal breakout.
    please guide us about this possiblity.

    Reply
  13. Yan on October 15, 2011 5:26 pm

    Sir, I see the big bull trend of GOLD might not finished yet, far from finished in fact. here is the weekly chart of GOLD with possible wave count I did. would appreciate your view on this weekly wave count please. Many Thanks.

    Weekly:
    http://screencast.com/t/grYHs86xB38

    4hrs:
    http://screencast.com/t/lANJyryoBaJ9

    Reply
  14. HARSH DIXIT on October 16, 2011 11:33 pm

    hi, yan
    pls tell me that which software you use for these analysis.i serch from a long time . and these counts may be right but not sure because ramki sir clear that many times here that there are always possiblities of any other counts.
    thanx in advance.

    Reply
    • Yan on October 17, 2011 4:49 am

      Hi Harsh, I am not sure what do you mean by ‘software’. I use standard MT4 Forex platform. and these wave counts were created manually by me. there is no software.

      Reply
  15. Shrikant on October 17, 2011 11:04 pm

    Dear Sir,

    Any New Update On Gold & SILVER.

    Sir I Purchased Your Book & Started Reading , Hope Learn Something New In Book.

    Thanks

    Reply
  16. Pingback: Elliott Wave update on Gold 21 Nov 2011 | ELLIOTT WAVE theory & practice explained

Leave A Reply Cancel Reply

Recent Posts
  • Has Meta (Facebook) stock seen the bottom
  • What Is The Nearest Technical Support For Meta (NASDAQ: FB)
  • Using Elliott Waves to Capture a Trade in S&P500
  • Hedge Funds and Elliott Waves – Netflix $NFLX
  • When Elliott Waves applauds the promoter’s signals!

WaveTimes is a Research Organization dedicated to providing original analysis, reports, reviews, and insights on developments in mutual funds, stocks, investing, foreign exchange, commodities, and bonds.

Contact WaveTimes

L-601 Mantri Espana,

Kariyammana Agrahara, Bellandur, Bangalore 560103

Follow Us

  • Facebook
  • YouTube
  • Twitter

© 2023 Wave Times. All Rights Reserved.
  • About
  • Books
  • Privacy Policy
  • Policies and Standards

Type above and press Enter to search. Press Esc to cancel.