• About
  • Elliott Waves
    • Elliott Waves Explained
    • Elliott Wave Magic Illustrated with Wave Charts
    • Elliott Wave Edge – How Elliott Wave Traders Win
    • Fibonacci Number Series and Elliott Waves
    • How to use Fibonacci Ratio Retracements
    • Elliott Wave Books
      • The Elliott Wave Book – Five Waves to Financial Freedom
      • Dividend Growth Investing Using Elliott Waves
    • Videos
  • Equities
    • Indices
      • Africa
        • Egypt
      • Australia
      • European Indices
        • AEX – Index, Amsterdam
        • DAX Index
        • Istanbul
        • Russia
        • Spain’s IBEX 35
      • Asian Indices
        • India
        • China
        • Dubai
        • Kuwait
        • Kuala Lumpur
        • Pakistan
        • Saudi
        • Taiwan
      • US Indices
        • S&P500
        • Nasdaq
        • Dow Jones
        • Dow Jones Utilities
    • Stocks
      • Asian Stocks
        • Indian Stocks Trading
        • Dubai Stocks Outlook
        • Japanese Stocks
        • Kuwait stocks
        • Saudi Stocks Outlook
      • African Stocks
        • Egyptian Stocks
      • Swiss Stocks
      • Australian Stocks
      • European Stocks
      • US Stocks outlook
      • UK Stocks
  • Commodities
    • Copper
    • Gasoline
    • Gold
    • Natural Gas
    • Oil
    • Palm Oil
    • Raw Sugar
    • Rubber
    • Soybean Oil
    • Silver
  • Forex
    • AUD
    • Bitcoin
    • CAD
    • CHF
    • Euro
    • GBP
    • INR
    • NZD
    • JPY
  • Raves
  • Consulting
    • Consulting
  • Ramki’s Watchlist
Top News

Has Meta (Facebook) stock seen the bottom

March 21, 2022

What Is The Nearest Technical Support For Meta (NASDAQ: FB)

February 7, 2022

Using Elliott Waves to Capture a Trade in S&P500

January 27, 2022
Facebook Twitter Instagram
WaveTimes Blog WaveTimes Blog
Wave times
  • About
  • Elliott Waves
    • Elliott Waves Explained
    • Elliott Wave Magic Illustrated with Wave Charts
    • Elliott Wave Edge – How Elliott Wave Traders Win
    • Fibonacci Number Series and Elliott Waves
    • How to use Fibonacci Ratio Retracements
    • Elliott Wave Books
      • The Elliott Wave Book – Five Waves to Financial Freedom
      • Dividend Growth Investing Using Elliott Waves
    • Videos
  • Equities
    • Indices
      • Africa
        • Egypt
      • Australia
      • European Indices
        • AEX – Index, Amsterdam
        • DAX Index
        • Istanbul
        • Russia
        • Spain’s IBEX 35
      • Asian Indices
        • India
        • China
        • Dubai
        • Kuwait
        • Kuala Lumpur
        • Pakistan
        • Saudi
        • Taiwan
      • US Indices
        • S&P500
        • Nasdaq
        • Dow Jones
        • Dow Jones Utilities
    • Stocks
      • Asian Stocks
        • Indian Stocks Trading
        • Dubai Stocks Outlook
        • Japanese Stocks
        • Kuwait stocks
        • Saudi Stocks Outlook
      • African Stocks
        • Egyptian Stocks
      • Swiss Stocks
      • Australian Stocks
      • European Stocks
      • US Stocks outlook
      • UK Stocks
  • Commodities
    • Copper
    • Gasoline
    • Gold
    • Natural Gas
    • Oil
    • Palm Oil
    • Raw Sugar
    • Rubber
    • Soybean Oil
    • Silver
  • Forex
    • AUD
    • Bitcoin
    • CAD
    • CHF
    • Euro
    • GBP
    • INR
    • NZD
    • JPY
  • Raves
  • Consulting
    • Consulting
  • Ramki’s Watchlist
WaveTimes Blog WaveTimes Blog
Home » Elliott Wave Analysis of German DAX (DE30) Index post Brexit
DAX Index

Elliott Wave Analysis of German DAX (DE30) Index post Brexit

RamkiBy RamkiJune 25, 2016Updated:January 31, 202311 Comments3 Mins Read
Facebook Twitter LinkedIn Telegram Pinterest Tumblr Reddit WhatsApp Email
Share
Facebook Twitter LinkedIn Pinterest Email

Elliott Wave analysis of the German DAX (DE30) index would have guided us well ahead of time about the deep correction that is underway in the European stock markets. This post discusses how we could have used Elliott Wave analysis to anticipate key turning points in the benchmark index, and taken steps to lighten our equity exposures. The steps I use have all been explained in detail in the Elliott Wave book “Five Waves to Financial Freedom”. Let us start by looking at the various waves since the significant low of 3588 on 13 March 2009.
Wave 1
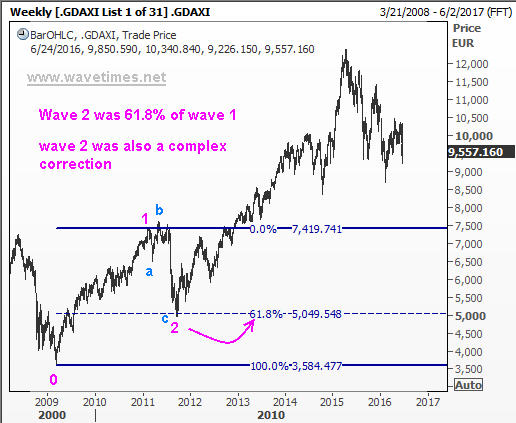
The first wave, or what we label as wave 1, went from the low of 3588 to a high of 7442. If you look at the intra-day charts of the German Dax during this period, you will be able to see that this wave 1 had its own set of five sub waves. You will also notice that sub wave 3 within this wave 1 was extended, in that it traveled more than 161.8% of sub wave 1. Thus, I would have determined that wave 1 was extended, giving a low probability for either of the upcoming impulse waves to extend. However, the more interesting development happened subsequently. But first, let us look at the chart.

Wave 1 of the German Dax index
Wave 1 and wave 2 of the German Dax index

Wave 2
Wave 2 was a complex correction. It has traced what is described in the Elliott Wave book “Five Waves to Financial Freedom” as an irregular correction. Notice that sub wave b posted a high that went above the end of wave 1. We then got a deep sell off as wave c to compete a three-step complex correction. The fact that wave 2 was deep is important at that time because it signaled to us that wave 4 will likely be short and simple.

Wave 3
Next we look at the third wave, or wave 3. Observe that it reached slightly higher than the 123.6% Fibonacci ratio projection of wave 1.

Wave 3 of the Dax index was a normal wave

Wave 4
As anticipated earlier on, wave 4 was a brief and short correction. It was also a normal zigzag correction. Traders and investors would have added to their holdings on this dip. When I advise my high-net-worth clients and fund managers, I recommend them to add more to their core holdings during this fourth wave dip.

Wave 5
And finally, Wave 5 finished exactly at the 61.8% measure of the distance traveled from point 0 to point 3. This is quite an amazing phenomenon, and has been described in detail in my book. Now you tell me, which other approach to the financial markets can be more accurate than this in anticipating the end of a bull cycle!

Wave 5 of the German Dax index finished exactly at 61.8% of 0-3

Conclusion:
I agree that it is not easy for traders and investors to be able to label waves with confidence, which is why many high networth individuals and hedge fund managers seek the advice of professionals. But, you too can improve your performance in the stock market by paying simple attention to some relatively straight forward rules and guidelines. I wish you all the best. Ramki

complex correction Elliott Wave Analysis German Dax Wave 1 Wave 3 Wave 5
Share. Facebook Twitter Pinterest LinkedIn Tumblr Telegram Email
Previous ArticleElliott Waves Suggest Bottom Is Not Yet In For Energy Stocks
Next Article Elliott Wave analysis suggests Willdan Group, Inc on wave 3
Ramki
  • Website

Related Posts

How Elliott Wave Analysis Helped Pick a Stock that Returned 80% in 4 months

February 18, 2018

Another Real-Life Elliott Wave Trade Example

January 23, 2018

Pfizer stock looks vulnerable

November 2, 2017
View 11 Comments

11 Comments

  1. himanshu mehta on June 26, 2016 11:56 am

    sir,

    after high of 12391 of april 2015
    low of 8699 of feb 2016 is wave A ?
    then
    10474 being “B”
    now wave “C”

    thanks

    h.mehta

    Reply
    • Ramki Ramakrishnan on July 19, 2016 9:26 am

      Himanshu, One can label the waves accurately only AFTER the move is over. Prior to that, all labels are tentative. One should then use his experience and understanding of wave personality, the position of the waves in the sequence, as well as underlying market sentiment to make real-time decisions.Elliott Waves offer you the framework for doing this.

      Reply
  2. YC VOON on June 30, 2016 7:44 am

    Hi Ramki, you mentioned that sub wave 3 within wave one was extended but – sub wave 3 within wave 3 was extended as well (as it also traveled more than 161.8% of wave 1 of wave 3). Could it be that wave 5 is actually wave 3 since there is a tendency for wave 3 to be the longest wave?

    Reply
    • Ramki Ramakrishnan on July 19, 2016 9:19 am

      YC Voon, That is a great question. Yes, everything is possible. We could even reach new highs or at least re-test old highs. The key thing is to be able to USE elliott waves when the market is live, and take sensible decisions. There is always a risk of loss, but you would minimize these losses and produce sizeable winners by positioning at the end of ‘possible’ turn levels.Good luck.

      Reply
  3. Imran on July 3, 2016 5:41 pm

    Always Amazing 🙂

    Acc to FWTFF the correction to follow once a 5 wave is completed should be bigger and take longer than the previous two corrections i.e wave 2 [61.8] and wave 4.

    Taking this into account and computing the 61.8 and 50% retracement of Larger wave 1 would the possible targets of 7600-8500 be reasonable ?

    Reply
    • Ramki Ramakrishnan on July 19, 2016 9:15 am

      Imran, The right way to measure is the actual distance (in points) moved by waves 2 and 4, and the actual number of days each of these waves took. Then you can measure that distance from the peak of the 5th wave as the minimum target.

      Reply
  4. Kumar on July 6, 2016 11:01 am

    Dear Ram,

    probably there is one approach but i am not sure whether it can be called better approach than this method and the time would tell the answer….

    For the record, i would share the approach after the following ( IF it happens true shortly ..)
    I know a reversal point very close by to the recent lows and then new highs is my expectation..( exact levels later)..
    Cheers..
    Kumar

    Reply
    • Ramki Ramakrishnan on July 19, 2016 9:23 am

      Kumar, My question was more ‘rhetoric’ in nature! Of course there are many approaches to trading and some may be even superior to Elliott Waves. I always urge traders to follow their heart. If they are comfortable with some other method, then they should embrace it. As for the DAX, please see my response to YCVoon’s question below. Cheers

      Reply
      • kumar on July 22, 2016 3:50 pm

        Dear Ram,
        As always a pleasure to hear your response..

        Could you please post you next message on GOLD as it has been a very long time since you updated it.

        thanks and Cheers
        Kumar

        Reply
  5. BHARAT MANGUKIYA on April 11, 2020 10:03 am

    Hello Sir ,

    How wave 2 as abc is here complex correction? I understand from your book complex correction has abc X abc structure but here only abc (Inverted Flat pattern) . so it shall be simple correction.

    I understand that,
    Simple correction like Zig zag or Flate
    Complex correction like more than two or three simple corrections with “X” wave

    Am I wrong sir? pls guide

    Reply
    • Ramki Ramakrishnan on April 18, 2020 11:33 am

      Bharat, By definition, a Flat correction is a complex correction. IN this case, we see an irregular ‘b’ wave which is certainly a complex correction.

      Reply

Leave A Reply Cancel Reply

Recent Posts
  • Has Meta (Facebook) stock seen the bottom
  • What Is The Nearest Technical Support For Meta (NASDAQ: FB)
  • Using Elliott Waves to Capture a Trade in S&P500
  • Hedge Funds and Elliott Waves – Netflix $NFLX
  • When Elliott Waves applauds the promoter’s signals!

WaveTimes is a Research Organization dedicated to providing original analysis, reports, reviews, and insights on developments in mutual funds, stocks, investing, foreign exchange, commodities, and bonds.

Contact WaveTimes

L-601 Mantri Espana,

Kariyammana Agrahara, Bellandur, Bangalore 560103

Follow Us

  • Facebook
  • YouTube
  • Twitter

© 2023 Wave Times. All Rights Reserved.
  • About
  • Books
  • Privacy Policy
  • Policies and Standards

Type above and press Enter to search. Press Esc to cancel.