 Most traders in the commodity and energy markets watch technical levels very closely. Some say that prices follow technicals because traders watch the technical levels. Others (especially those who practice Elliott Wave Analysis) would say that when the herd mentality rules the market, certain types of movements can be anticpated, not because traders watch those levels, but because the underlying emotions of greed and fear tend to exert their influence on the markets.
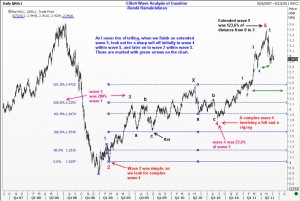
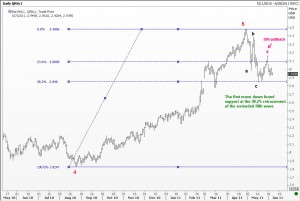
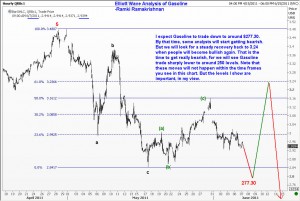
Take the case of Gasoline. A five wave rally has been completed at $348, and hence we should lookout for a good sized correction. But a careful analysis of the internal waves of the rally to 348 shows that we had an extended fifth wave. Time and time again, whenever a rally finishes with an extended fifth wave, we will get a fairly quick sell off. The first target for the sell off is usually the prior fourth wave of one lesser degree. In the case of Gasoline, this level comes at 277.30. We have already come off by over 15% from the top, and it looks like we can get another 7%.
Typically, when prices breaks below the immediately preceding low, we will hear from some market participants that they are now more bearish. However, using Elliott Wave Analysis, one can say with a reasonable degree of confidence that Gasoline will probably experience one more rally that will take it back to at least the 316 level, more likely to the 323 levels. Should such a rally materialize as I am anticipating, these same traders who became bearish at the lows will turn bullish. Alas, that will be a trap for many because the completion of five waves in the larger rally that finished at 348 would require a much deeper correction, perhaps down to the 250 levels. So Elliott Wave Analysts would then call Gasoline down from near 323. 
What can go wrong with this analysis? Well, just about everything! But what the wave analyst is offering is an evaluation of probabilities. From past experience, the turns that I am anticipating are highly probable, but not guaranteed. So how can one use this information? The best way to take advantage of elliott wave analysis is knowing where the risk lies, and choosing low-risk levels to position in the direction that wave analysis points you to. For example, I think we will have some good resistance near the $305 levels. Any recovery that fails there will be a cue to go short. Again, as we approach the immediately preceding low around 284, we should lighten up on shorts and wait to see what happens between there and 277.30. If it gets choppy down there, it is not an indication of continuation of sell off, rather the preparation for a bounce that will cause a lot of blood to flow on the trading floors. We will review the chart of Gasoline again as we approach the key levels.

