• About
  • Elliott Waves
    • Elliott Waves Explained
    • Elliott Wave Magic Illustrated with Wave Charts
    • Elliott Wave Edge – How Elliott Wave Traders Win
    • Fibonacci Number Series and Elliott Waves
    • How to use Fibonacci Ratio Retracements
    • Elliott Wave Books
      • The Elliott Wave Book – Five Waves to Financial Freedom
      • Dividend Growth Investing Using Elliott Waves
    • Videos
  • Equities
    • Indices
      • Africa
        • Egypt
      • Australia
      • European Indices
        • AEX – Index, Amsterdam
        • DAX Index
        • Istanbul
        • Russia
        • Spain’s IBEX 35
      • Asian Indices
        • India
        • China
        • Dubai
        • Kuwait
        • Kuala Lumpur
        • Pakistan
        • Saudi
        • Taiwan
      • US Indices
        • S&P500
        • Nasdaq
        • Dow Jones
        • Dow Jones Utilities
    • Stocks
      • Asian Stocks
        • Indian Stocks Trading
        • Dubai Stocks Outlook
        • Japanese Stocks
        • Kuwait stocks
        • Saudi Stocks Outlook
      • African Stocks
        • Egyptian Stocks
      • Swiss Stocks
      • Australian Stocks
      • European Stocks
      • US Stocks outlook
      • UK Stocks
  • Commodities
    • Copper
    • Gasoline
    • Gold
    • Natural Gas
    • Oil
    • Palm Oil
    • Raw Sugar
    • Rubber
    • Soybean Oil
    • Silver
  • Forex
    • AUD
    • Bitcoin
    • CAD
    • CHF
    • Euro
    • GBP
    • INR
    • NZD
    • JPY
  • Raves
  • Consulting
    • Consulting
  • Ramki’s Watchlist
Top News

Has Meta (Facebook) stock seen the bottom

March 21, 2022

What Is The Nearest Technical Support For Meta (NASDAQ: FB)

February 7, 2022

Using Elliott Waves to Capture a Trade in S&P500

January 27, 2022
Facebook Twitter Instagram
WaveTimes Blog WaveTimes Blog
Wave times
  • About
  • Elliott Waves
    • Elliott Waves Explained
    • Elliott Wave Magic Illustrated with Wave Charts
    • Elliott Wave Edge – How Elliott Wave Traders Win
    • Fibonacci Number Series and Elliott Waves
    • How to use Fibonacci Ratio Retracements
    • Elliott Wave Books
      • The Elliott Wave Book – Five Waves to Financial Freedom
      • Dividend Growth Investing Using Elliott Waves
    • Videos
  • Equities
    • Indices
      • Africa
        • Egypt
      • Australia
      • European Indices
        • AEX – Index, Amsterdam
        • DAX Index
        • Istanbul
        • Russia
        • Spain’s IBEX 35
      • Asian Indices
        • India
        • China
        • Dubai
        • Kuwait
        • Kuala Lumpur
        • Pakistan
        • Saudi
        • Taiwan
      • US Indices
        • S&P500
        • Nasdaq
        • Dow Jones
        • Dow Jones Utilities
    • Stocks
      • Asian Stocks
        • Indian Stocks Trading
        • Dubai Stocks Outlook
        • Japanese Stocks
        • Kuwait stocks
        • Saudi Stocks Outlook
      • African Stocks
        • Egyptian Stocks
      • Swiss Stocks
      • Australian Stocks
      • European Stocks
      • US Stocks outlook
      • UK Stocks
  • Commodities
    • Copper
    • Gasoline
    • Gold
    • Natural Gas
    • Oil
    • Palm Oil
    • Raw Sugar
    • Rubber
    • Soybean Oil
    • Silver
  • Forex
    • AUD
    • Bitcoin
    • CAD
    • CHF
    • Euro
    • GBP
    • INR
    • NZD
    • JPY
  • Raves
  • Consulting
    • Consulting
  • Ramki’s Watchlist
WaveTimes Blog WaveTimes Blog
Home » Elliott Wave Analysis of Freeport-McMoRan Inc. (FCX) -NYSE
US Stocks outlook

Elliott Wave Analysis of Freeport-McMoRan Inc. (FCX) -NYSE

RamkiBy RamkiFebruary 8, 201610 Comments4 Mins Read
Facebook Twitter LinkedIn Telegram Pinterest Tumblr Reddit WhatsApp Email
Share
Facebook Twitter LinkedIn Pinterest Email

The global stock market is so vast that the more eyes there are to spot the approaching end of a five-wave pattern, the better off we are! I should thank Bob D for drawing my attention to Freeport-McMoran Inc (FCX) -NYSE. The following discussion covers the Elliott Wave analysis of this stock. You will see how the various twists and turns in FCX were all following the dictates of the Elliott Wave Principle.

When we commence the analysis of any instrument, it is always better to start with the bigger picture. So we commence our study with the weekly chart of FReeport-McMorRan Inc.You got to remember that the goal of any analysis is to provide you with a framework to base your investment or trade. Such a framework will give you an orderly way to approach the market. It doesn’t guarantee you profits, but you will know quite early whether you are on the right track or not, and that knowledge alone is well worth the time you invest in this process. So lets get started with our first Elliott Wave chart. I suggest that you keep opening each chart in a new tab to save you time.

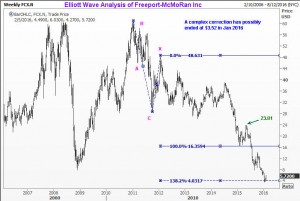
On 20 January 2016, FCX made a low of $3.52. We see from the chart below that a complex correction has developed from the high near $61, probably unfolding as a double zigzag. The end of the second zigzag was projected to land at a 138.2% projection just a shade above the $4 mark. Perhaps the 3.52 low marked the end of this major correction?

FCX4Feb2016a

Now let us quickly go down to the more recent moves. Notice the green arrow in the chart above? I suggest we start our next wave count from there, as it looks like a pivot point.Two things stand out clearly. We can make out a set of five waves from near the $24, and to our delight, there is a further set of 5 minor waves inside the fifth wave that is quite clear.

FCX4Feb2016b

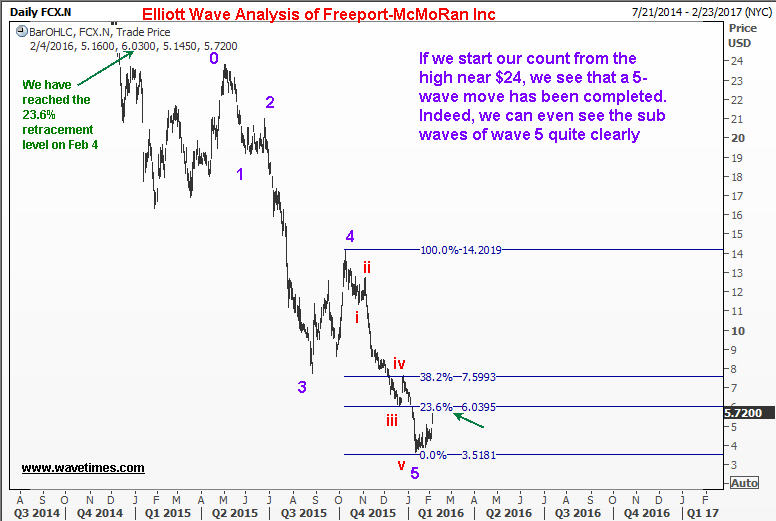
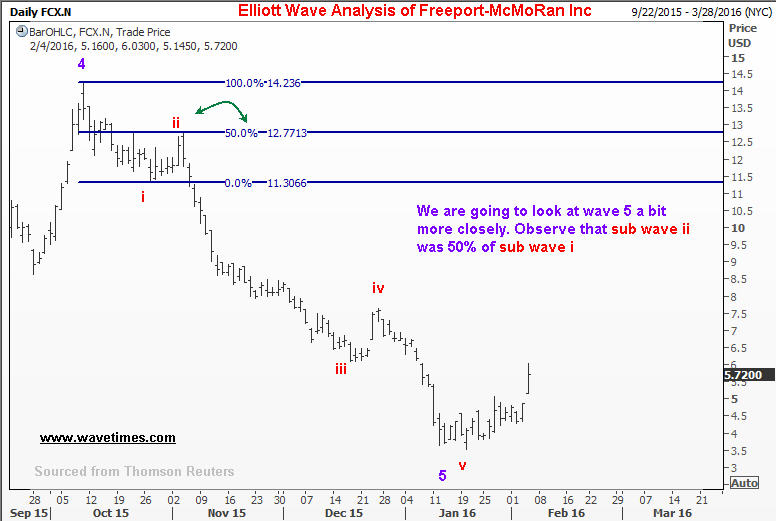
In order to give us more comfort that about this fifth wave, we will delve deeper to see if the waves hold some Fibonacci ratio relationship to each other. The chart below shows that sub wave ii corrected the sub wave i by 50%

FCX4Feb2016c

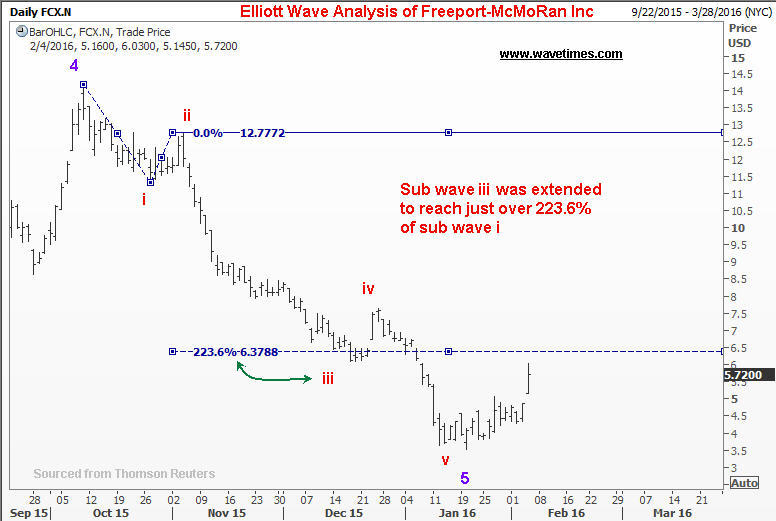
Next we see that the sub wave iii was extended. An extension is when an impulse wave travels more than 161.8% (Note: this is my own interpretation of when to label a wave as extended). In this case, sub wave iii went as far as 223.6% of wave i.

FCX4Feb2016d

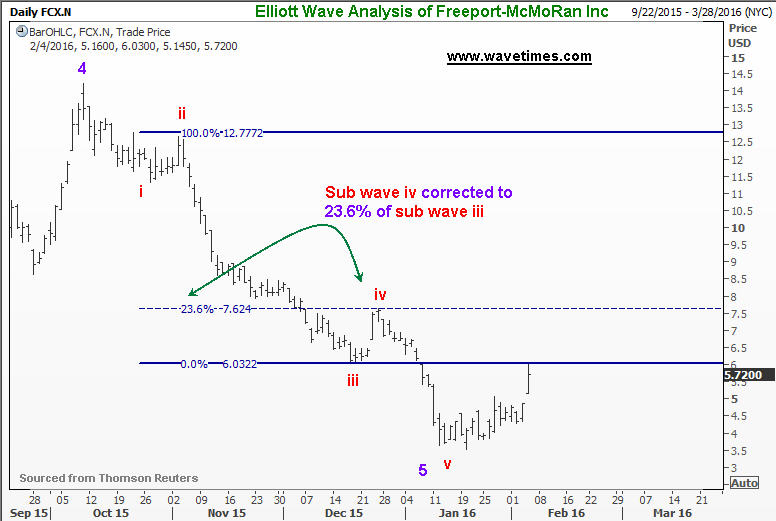
You might remember from your reading of my book ‘Five Waves to Financial Freedom” that when a third wave is extended, it is normal for the fourth wave to be short and typically correct to just 23.6% of the just completed third wave. You can see from the Elliott wave chart of Freeport-McMoRan Inc below that sub wave iv went exactly to the 23.6% retracement target. This sort of reinforces the feeling that we are on the right track!

FCX4Feb2016e

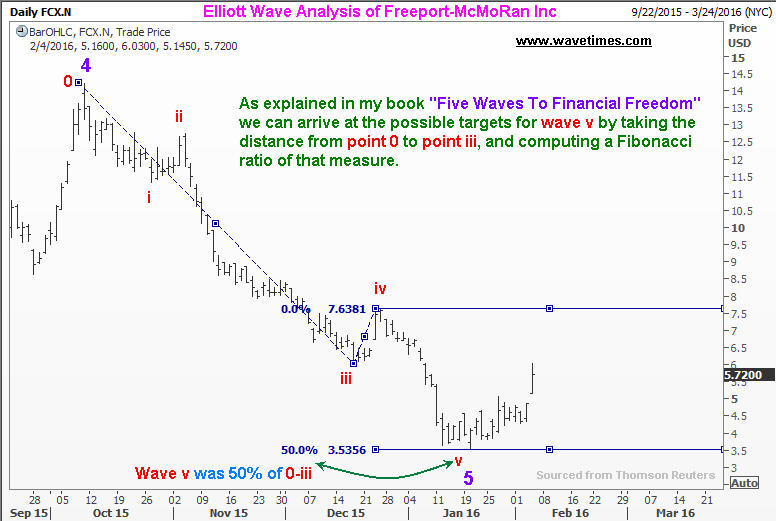
And finally, we see that the fifth wave was exactly 50% of the distance from the point ‘0’ or the starting point of subwave i to the terminal point of subwave iii. This is again quite text-book-like, and is something to be looked at in wonderment!

FCX4Feb2016f

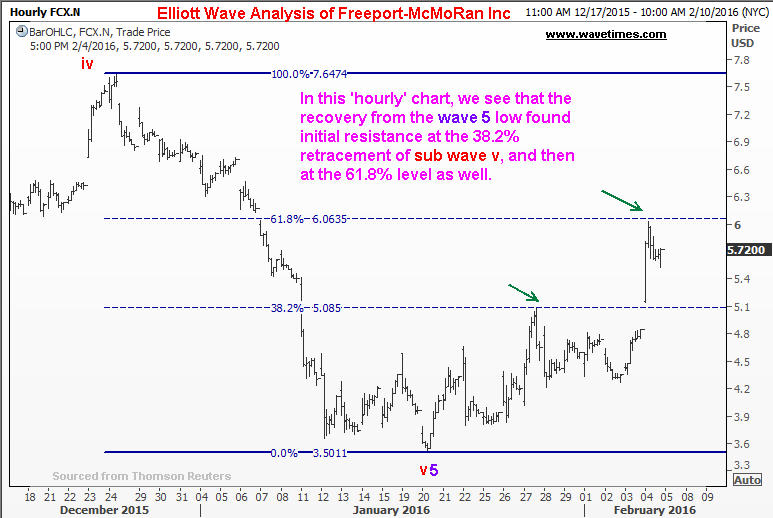
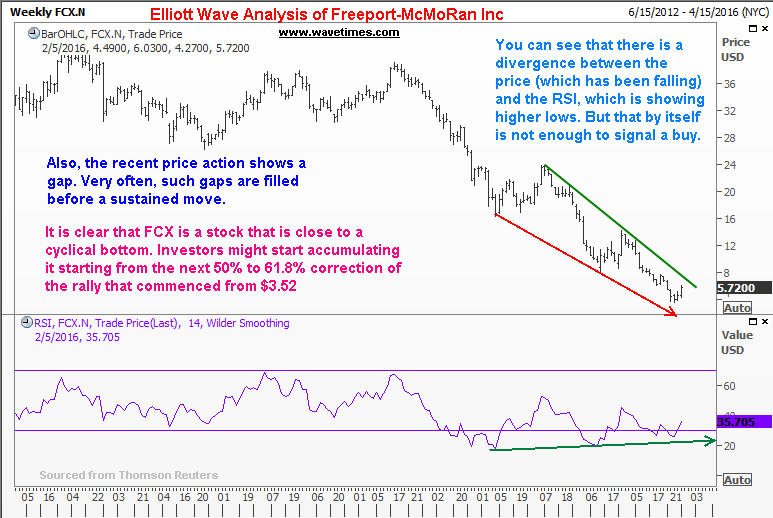
I leave you with two more charts for careful consideration. My Elliott Wave comments are on the charts themselves. Remember, this blog aims to teach you some of my methods. I am not making a recommendation here. But if you are patient, and if you can identify 5 waves up from the bottom, then buying into a 50% to 61.8% pull back is a most logical thing to do, especially if you are a believer that Elliot Wave Principle works! In case you are not convinced, simply look at the hundreds of other examples in this blog! All the best.

FCX4Feb2016g

FCX4Feb2016h

elliot wave Elliott Wave Analysis Freeport-McMoRan Inc
Share. Facebook Twitter Pinterest LinkedIn Tumblr Telegram Email
Previous ArticleSeven weeks working ‘pro bono’ with a charity
Next Article Elliott Wave Analysis of The Value Line Geometric Composite Index
Ramki
  • Website

Related Posts

Has Meta (Facebook) stock seen the bottom

March 21, 2022

What Is The Nearest Technical Support For Meta (NASDAQ: FB)

February 7, 2022

Hedge Funds and Elliott Waves – Netflix $NFLX

January 17, 2022
View 10 Comments

10 Comments

  1. Mahesh on February 9, 2016 5:14 pm

    Dear sir,
    Thank you very much for this post.
    You are my “GURU” when it comes to Elliot wave analysis.
    Can you please post your count from “X” wave high ($48.631) to 4th May 2015($23.81) high?
    Thanks in advance.

    Reply
    • Ramki Ramakrishnan on February 18, 2016 9:12 pm

      Mahesh, Dont get trapped in analysis paralysis, as they say! It serves us no purpose to figure out what could have been the internal waves within a complex correction. That is all history. We make an assumption of the count in the big picture and quickly move down to a time frame that offers us some value…

      Reply
  2. Greg on April 28, 2016 6:24 pm

    Hi Ramki,
    Thanks for posting this analysis. I’m learning your methods so to spaeak and I have 2 questions if I may:

    1. You started your count from 23.81, what you said looked like a pivot point. Why? What makes it a pivot point?

    2. Sub-wave v extended 50% of 0-iii. I can’t see where you’ve said that this level is significant in your book. You talk only of 38.2 & 61.8 (and the levels for an extended wave and equality to wave 3). Apart from 50% being an important fib level is it significant? I would have thought that you would have expected it to continue to the 61.8.

    Thanks,
    Greg

    Reply
    • Ramki Ramakrishnan on April 29, 2016 6:26 pm

      Greg, (1) A pivot point is typically the end of wave 4, and you are making assumptions about that point while determining a possible turn is happening at the end of wave 5. (2) You are right, I didn’t mention 50% in the book, but I didn’t want to make it overly complicated. But there are dozens of examples of that phenomenon in this blog, and I support this blog because it is a ‘living book’, and extension of the book, or vice versa.

      Reply
  3. Greg on May 14, 2016 1:50 pm

    Ok Thanks Ramki.
    I’d like to as another question that is a general question if I may and not related to this post. I hope that’s ok. There is something that puzzles me about the EW sequence. I’ve searched for the answer in a lot of places to no avail. I’m starting to think that my reasoning must be wrong due to this total lack of information, but I have to ask you for my peace of mind. Ok here goes.
    The EW sequence is 5 waves up (comprising of 3 impulse waves and 2 corrections) and then 3 waves down (A,B,C comprising 2 impulse waves and 1 correction. In total 8 waves which would be one complete cycle. After the first 5 waves we would have wave I of a larger degree and after the 3 wave correction (A,B,C) we have wave II of a larger degree. Ok so far so good. This is where I now find it puzzling. It seems that the next wave can only resume in the same direction as the first wave, it being wave 1 of the higher degree wave III. If this is so then how will the direction ever change (apart from the corrections)? In an uptrend we will continue up and up and up. And vice versa in a downtrend of course. How does price ever change direction completely, not just as a correction? I hope you understand what I mean! I know I’m missing something! Until I comprehend this I will always have a problem with EW, and I don’t want that because I know it works!

    Cheers,
    Greg

    Reply
    • Ramki Ramakrishnan on May 19, 2016 7:50 pm

      Hi Greg, Thanks for that question. We have to remember that the Elliott Wave Principle is based on continued world growth, even over the Grand Super Cycle. It is a useful basis to build our investment thesis on. The main direction of the Grand Super Cycle is always upward, and any downward move is always a correction of some lower degree. You may ask why should we make this assumption in the first place. It is like asking to prove the existence of God. I have spoken to many eminently qualified doctors who tell me that they may claim to save lives, but in truth, they only played a part in treating the patient. They made certain assumptions and proceeded with the treatment. Likewise, we will make this assumption, and make our investment decisions. We will know when things are going wrong soon enough, and make adjustments, just like the doctor does with his patients.

      Reply
      • Greg on May 22, 2016 11:23 pm

        Hmmm. I don’t really know how to answer that if I’m honest. What you’re basically saying is that over the long term (and that could be many years) the market, whatever it is, will eventually move upward. But what I really need to know to understand EW theory is what to look for to anticipate a change in trend. Nowhere in your book, and correct me if I’m wrong, do you really explain how the matket goes from an uptrend to a downtrend and vice versa. An ABC correction occurs before the market continues in the direction it previously had. But it doesn’t always do that. There must be some sort of double or triple or quadruole etc etc ABC and then the market takes off in the other direction. Or something to that effect. Is it possible to be a bit more specific?

        Many thanks,
        Greg

        Reply
        • Ramki Ramakrishnan on May 24, 2016 8:36 pm

          Hi Greg, I understand it is hard to swallow if someone says that in general, all markets will grow over time. But that is what it is. The trend of man’s progress is ever upwards. All economic activity is geared to sustain and grow man’s lot. True, there will be episodes of set backs, disasters (man made or caused by nature), but the declines that are seen in such periods are merely corrections.

          Regarding whether I have adequately covered how a market goes from uptrend to downtrend and vice versa, I submit that the whole book is about these things, in varying degrees! When wave 1 ends, we enter a mini down trend. When wave 4 ends, we commence an uptrend. How to spot the likely turning points is covered in as much detail as simplicity will allow. Many people find that a second or third read of the book will cause a new understanding that was previously not forthcoming. I wish you good luck in your pursuits.

          Reply
  4. Greg on May 25, 2016 1:15 pm

    Once again Ramki. Thanks for that.

    Ok I accept the point you’re making about growth. I don’t have a problem with that. And you are correct, you do cover reversals/corrections in the market like you say. But I still contend that you don’t really go into what can happen after the C wave at the end of the 8 wave cycle. You explain corrections within the 5 wave pattern and also in the subsequent A,B,C pattern. But not after that. You see it’s right at this point that I am talking about. It seems to me that this is a critical point and one that you don’t really cover, at least to my mind. What do we look for after C has completed? Sometimes we don’t even get an A,B,C pattern after the 5 waves. Price just seems to start another 5 wave pattern. This is what puzzles me. I’m missing someting and it’s crucial to understanding EW theory. I’m sorry if I’m not being clear but I don’t know how to explain it in any other way. Thanks for your time and patience!

    Cheers,
    Greg

    Reply
    • Ramki Ramakrishnan on May 29, 2016 2:03 pm

      Greg, I appreciate that it is not easy to assimilate something when we have the feeling that something is not explained fully. Why don’t you just think about the cycles as an ever expanding one at the highest degree, and downward movements within that very large cycle will be corrections! Maybe that approach will help you come to terms with the theory. But as explained in my book and in this blog, true success comes to those who “use” the theory to actually trade. If we try to fit the market to the theory, we will be endlessly pursuing to prove either the theory is wrong, or we are correct, and the end result will be nothing much to show. Thus, go with the flow of the market, see if you can spot a 5 wave pattern and trade that cycle. You can’t go far wrong with that approach. Good luck!

      Reply

Leave A Reply Cancel Reply

Recent Posts
  • Has Meta (Facebook) stock seen the bottom
  • What Is The Nearest Technical Support For Meta (NASDAQ: FB)
  • Using Elliott Waves to Capture a Trade in S&P500
  • Hedge Funds and Elliott Waves – Netflix $NFLX
  • When Elliott Waves applauds the promoter’s signals!

WaveTimes is a Research Organization dedicated to providing original analysis, reports, reviews, and insights on developments in mutual funds, stocks, investing, foreign exchange, commodities, and bonds.

Contact WaveTimes

L-601 Mantri Espana,

Kariyammana Agrahara, Bellandur, Bangalore 560103

Follow Us

  • Facebook
  • YouTube
  • Twitter

© 2023 Wave Times. All Rights Reserved.
  • About
  • Books
  • Privacy Policy
  • Policies and Standards

Type above and press Enter to search. Press Esc to cancel.