• About
  • Elliott Waves
    • Elliott Waves Explained
    • Elliott Wave Magic Illustrated with Wave Charts
    • Elliott Wave Edge – How Elliott Wave Traders Win
    • Fibonacci Number Series and Elliott Waves
    • How to use Fibonacci Ratio Retracements
    • Elliott Wave Books
      • The Elliott Wave Book – Five Waves to Financial Freedom
      • Dividend Growth Investing Using Elliott Waves
    • Videos
  • Equities
    • Indices
      • Africa
        • Egypt
      • Australia
      • European Indices
        • AEX – Index, Amsterdam
        • DAX Index
        • Istanbul
        • Russia
        • Spain’s IBEX 35
      • Asian Indices
        • India
        • China
        • Dubai
        • Kuwait
        • Kuala Lumpur
        • Pakistan
        • Saudi
        • Taiwan
      • US Indices
        • S&P500
        • Nasdaq
        • Dow Jones
        • Dow Jones Utilities
    • Stocks
      • Asian Stocks
        • Indian Stocks Trading
        • Dubai Stocks Outlook
        • Japanese Stocks
        • Kuwait stocks
        • Saudi Stocks Outlook
      • African Stocks
        • Egyptian Stocks
      • Swiss Stocks
      • Australian Stocks
      • European Stocks
      • US Stocks outlook
      • UK Stocks
  • Commodities
    • Copper
    • Gasoline
    • Gold
    • Natural Gas
    • Oil
    • Palm Oil
    • Raw Sugar
    • Rubber
    • Soybean Oil
    • Silver
  • Forex
    • AUD
    • Bitcoin
    • CAD
    • CHF
    • Euro
    • GBP
    • INR
    • NZD
    • JPY
  • Raves
  • Consulting
    • Consulting
  • Ramki’s Watchlist
Top News

Has Meta (Facebook) stock seen the bottom

March 21, 2022

What Is The Nearest Technical Support For Meta (NASDAQ: FB)

February 7, 2022

Using Elliott Waves to Capture a Trade in S&P500

January 27, 2022
Facebook Twitter Instagram
WaveTimes Blog WaveTimes Blog
Wave times
  • About
  • Elliott Waves
    • Elliott Waves Explained
    • Elliott Wave Magic Illustrated with Wave Charts
    • Elliott Wave Edge – How Elliott Wave Traders Win
    • Fibonacci Number Series and Elliott Waves
    • How to use Fibonacci Ratio Retracements
    • Elliott Wave Books
      • The Elliott Wave Book – Five Waves to Financial Freedom
      • Dividend Growth Investing Using Elliott Waves
    • Videos
  • Equities
    • Indices
      • Africa
        • Egypt
      • Australia
      • European Indices
        • AEX – Index, Amsterdam
        • DAX Index
        • Istanbul
        • Russia
        • Spain’s IBEX 35
      • Asian Indices
        • India
        • China
        • Dubai
        • Kuwait
        • Kuala Lumpur
        • Pakistan
        • Saudi
        • Taiwan
      • US Indices
        • S&P500
        • Nasdaq
        • Dow Jones
        • Dow Jones Utilities
    • Stocks
      • Asian Stocks
        • Indian Stocks Trading
        • Dubai Stocks Outlook
        • Japanese Stocks
        • Kuwait stocks
        • Saudi Stocks Outlook
      • African Stocks
        • Egyptian Stocks
      • Swiss Stocks
      • Australian Stocks
      • European Stocks
      • US Stocks outlook
      • UK Stocks
  • Commodities
    • Copper
    • Gasoline
    • Gold
    • Natural Gas
    • Oil
    • Palm Oil
    • Raw Sugar
    • Rubber
    • Soybean Oil
    • Silver
  • Forex
    • AUD
    • Bitcoin
    • CAD
    • CHF
    • Euro
    • GBP
    • INR
    • NZD
    • JPY
  • Raves
  • Consulting
    • Consulting
  • Ramki’s Watchlist
WaveTimes Blog WaveTimes Blog
Home » Elliott Wave Analysis of EUR/USD
Euro

Elliott Wave Analysis of EUR/USD

RamkiBy RamkiMay 29, 20112 Comments3 Mins Read
Facebook Twitter LinkedIn Telegram Pinterest Tumblr Reddit WhatsApp Email
Share
Facebook Twitter LinkedIn Pinterest Email

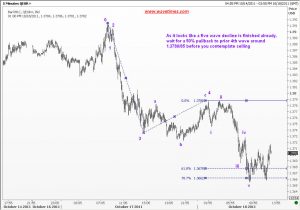
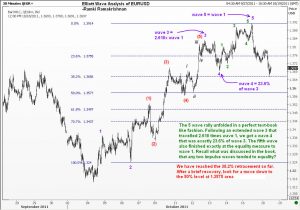
Now that the EURO has completed its 5 wave downmove from the high of 1.4939, we need to revisit the big picture and ask ourselves again, ‘Has the EURO really posted a medium term top at that level’? In order to play the devil’s advocate, I can present the following chart and say, no, the high at 1.4939 was just the “B” wave within an irregular wave 4, and so we are going back all the way to 1.5000 area.

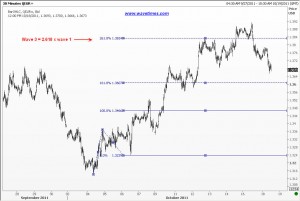
Well, it is not going to be so straight forward as that, I’m afraid. The recovery from the 1.3968 low is still looking a bit ‘un-impulsive’ and we need to see what happens at one of the three levels shown in chart 3 here. We really need to wait for a 5-wave decline once the current upmove is over. Only then can one speak with more confidence about whether it is a good time to sell again or not.

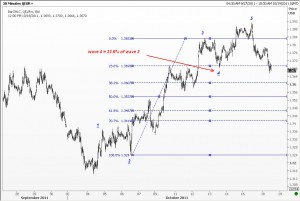
You may ask why this sudden bout of doubt? After all, only 3 weeks back I had declared that once a five wave downmove is over, it is all but certain that we are entering a new bear phase. First, it pays to be doubtful. This way, we remain alert to the earliest sign of trouble. All too frequently, a trader gets carried away with his view and remains convinced of his invincibility.(After all, he has spent an hour or two on the charts and come up with a great looking count! Take a look at the last chart, for instance! This is another way of counting 5 waves down…) And when the market rallies right back up, our poor elliott wave trader wil try and average up his shorts and get deeper into the hole he has dug for himself. So what are we trying to do here? First of all, we are trying to be objective. The market is going to do what it wants. We are trying to stay one step ahead by being aware of the different paths it may take, and that is accomplished by using our different wave counts. Secondly, we determine what is the most likely outcome of this tussle between bulls and bears. If we are uncertain of this, we try and figure out key levels from where the next counter trend move could start. These have been highlighted above. If we get a 5-wave decline from any of the said key levels, then we try to sell on a 50% pull back with a stop above the high just seen. If the Euro keeps going higher, we stay on the sidelines and wait for the move to run its course. You might ask, hey, lissen-up buddy! Are you telling me to miss the whole move from 1.4300 to 1.5000? What if I am importing machinery from Europe and need to hedge? Well, I can only point you to my earlier posts where I was looking for a move back higher once the 5 wave move was over. You should have asked me this question on the way down!! Humor aside, the recent moves only highlights the highly volatile nature of currency markets. It is alright for a trader to have volatility, because he can operate from both sides of the market with appropriate stops. But for the corporate treasurer, these markets are a daily nightmare. I can only empathise with him/her.

Share. Facebook Twitter Pinterest LinkedIn Tumblr Telegram Email
Previous ArticleCrude Oil Outlook
Next Article EUR/USD update
Ramki
  • Website

Related Posts

How we traded EURJPY recently

October 23, 2019

An example of EURUSD analysis using Elliott Waves

May 8, 2018

What WaveTimes could do for you in EURUSD

May 8, 2017
View 2 Comments

2 Comments

  1. Rohit on May 29, 2011 9:13 pm

    The fact that the move up starts from a 61.8% retracement for the move from 16/02/10 makes it an important review. I was wondering if this was wave IV that just finished, and V of C up is still forming, similar to gold

    Reply
    • Ramki on May 30, 2011 5:32 am

      Hi Rohit, The EUR/USD chart does propose a possible alternate there in that we could have seen the end of wave IV, and maybe we are starting Wave V. However, I am not suggesting that this is an open and shut case. I will discuss this in a new post today. Secondly, in Gold, I am still thinking the top is already in place, and we are only seeing the 2nd retracement that shows up after completion of an extended 5th.

      Reply

Leave A Reply Cancel Reply

Recent Posts
  • Has Meta (Facebook) stock seen the bottom
  • What Is The Nearest Technical Support For Meta (NASDAQ: FB)
  • Using Elliott Waves to Capture a Trade in S&P500
  • Hedge Funds and Elliott Waves – Netflix $NFLX
  • When Elliott Waves applauds the promoter’s signals!

WaveTimes is a Research Organization dedicated to providing original analysis, reports, reviews, and insights on developments in mutual funds, stocks, investing, foreign exchange, commodities, and bonds.

Contact WaveTimes

L-601 Mantri Espana,

Kariyammana Agrahara, Bellandur, Bangalore 560103

Follow Us

  • Facebook
  • YouTube
  • Twitter

© 2023 Wave Times. All Rights Reserved.
  • About
  • Books
  • Privacy Policy
  • Policies and Standards

Type above and press Enter to search. Press Esc to cancel.