• About
  • Elliott Waves
    • Elliott Waves Explained
    • Elliott Wave Magic Illustrated with Wave Charts
    • Elliott Wave Edge – How Elliott Wave Traders Win
    • Fibonacci Number Series and Elliott Waves
    • How to use Fibonacci Ratio Retracements
    • Elliott Wave Books
      • The Elliott Wave Book – Five Waves to Financial Freedom
      • Dividend Growth Investing Using Elliott Waves
    • Videos
  • Equities
    • Indices
      • Africa
        • Egypt
      • Australia
      • European Indices
        • AEX – Index, Amsterdam
        • DAX Index
        • Istanbul
        • Russia
        • Spain’s IBEX 35
      • Asian Indices
        • India
        • China
        • Dubai
        • Kuwait
        • Kuala Lumpur
        • Pakistan
        • Saudi
        • Taiwan
      • US Indices
        • S&P500
        • Nasdaq
        • Dow Jones
        • Dow Jones Utilities
    • Stocks
      • Asian Stocks
        • Indian Stocks Trading
        • Dubai Stocks Outlook
        • Japanese Stocks
        • Kuwait stocks
        • Saudi Stocks Outlook
      • African Stocks
        • Egyptian Stocks
      • Swiss Stocks
      • Australian Stocks
      • European Stocks
      • US Stocks outlook
      • UK Stocks
  • Commodities
    • Copper
    • Gasoline
    • Gold
    • Natural Gas
    • Oil
    • Palm Oil
    • Raw Sugar
    • Rubber
    • Soybean Oil
    • Silver
  • Forex
    • AUD
    • Bitcoin
    • CAD
    • CHF
    • Euro
    • GBP
    • INR
    • NZD
    • JPY
  • Raves
  • Consulting
    • Consulting
  • Ramki’s Watchlist
Top News

Has Meta (Facebook) stock seen the bottom

March 21, 2022

What Is The Nearest Technical Support For Meta (NASDAQ: FB)

February 7, 2022

Using Elliott Waves to Capture a Trade in S&P500

January 27, 2022
Facebook Twitter Instagram
WaveTimes Blog WaveTimes Blog
Wave times
  • About
  • Elliott Waves
    • Elliott Waves Explained
    • Elliott Wave Magic Illustrated with Wave Charts
    • Elliott Wave Edge – How Elliott Wave Traders Win
    • Fibonacci Number Series and Elliott Waves
    • How to use Fibonacci Ratio Retracements
    • Elliott Wave Books
      • The Elliott Wave Book – Five Waves to Financial Freedom
      • Dividend Growth Investing Using Elliott Waves
    • Videos
  • Equities
    • Indices
      • Africa
        • Egypt
      • Australia
      • European Indices
        • AEX – Index, Amsterdam
        • DAX Index
        • Istanbul
        • Russia
        • Spain’s IBEX 35
      • Asian Indices
        • India
        • China
        • Dubai
        • Kuwait
        • Kuala Lumpur
        • Pakistan
        • Saudi
        • Taiwan
      • US Indices
        • S&P500
        • Nasdaq
        • Dow Jones
        • Dow Jones Utilities
    • Stocks
      • Asian Stocks
        • Indian Stocks Trading
        • Dubai Stocks Outlook
        • Japanese Stocks
        • Kuwait stocks
        • Saudi Stocks Outlook
      • African Stocks
        • Egyptian Stocks
      • Swiss Stocks
      • Australian Stocks
      • European Stocks
      • US Stocks outlook
      • UK Stocks
  • Commodities
    • Copper
    • Gasoline
    • Gold
    • Natural Gas
    • Oil
    • Palm Oil
    • Raw Sugar
    • Rubber
    • Soybean Oil
    • Silver
  • Forex
    • AUD
    • Bitcoin
    • CAD
    • CHF
    • Euro
    • GBP
    • INR
    • NZD
    • JPY
  • Raves
  • Consulting
    • Consulting
  • Ramki’s Watchlist
WaveTimes Blog WaveTimes Blog
Home » Elliott Wave Analysis of EMAR Dubai
Dubai Stocks Outlook

Elliott Wave Analysis of EMAR Dubai

RamkiBy RamkiMay 12, 20105 Comments1 Min Read
Facebook Twitter LinkedIn Telegram Pinterest Tumblr Reddit WhatsApp Email
Share
Facebook Twitter LinkedIn Pinterest Email

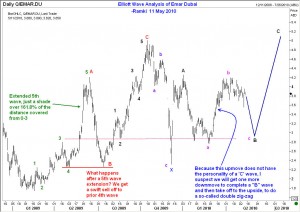
Elliott Wave Analysis of EMAR Dubai is more challenging than some other stocks because Emar has been moving  sideways for a while. This bellwether stock of the UAE still looks a bit soft to me and think we could get a dip as part of a B wave before the next rally can materialize. So plan your trades accordingly. It is never easy to trade in the middle of a complex correction, but once the current wave ‘c’ of the B wave is finished, we will get a strong recovery towards 5 AED.

Share. Facebook Twitter Pinterest LinkedIn Tumblr Telegram Email
Previous ArticleElliott Wave Analysis of Sabic (Saudi Arabia)
Next Article Elliott Wave Analysis of ADCB Abu Dhabi
Ramki
  • Website

Related Posts

Elliott Wave Analysis of Arabtec Holding Co Dubai

June 10, 2014

Elliott Wave Analysis of Emar, Dubai

May 1, 2012

Elliott Wave Analysis of EMAR

November 13, 2011
View 5 Comments

5 Comments

  1. mh on May 12, 2010 2:06 pm

    Thank you Mr. Ramki for your analysis they are really an enjoyment to read

    Reply
  2. ahmad on May 15, 2010 2:45 am

    Can you please comment on dfm market and emar?

    Reply
  3. dinesh on May 17, 2010 10:50 pm

    dear sir, i havent heard from you on your latest elliott wave count for sensex with charts for quite some time, can you pls update us on that. thankyou.

    Reply
  4. kamlesh s n on May 30, 2010 12:53 am

    hi sir. i m big fan of yours. i follow ur site regularly…i cant tell u how much i appreciate ur calls..i myself have started learning elliot wave but i m confused as ppl are divided on opinion that 2009 rally wave b of grand wave 2 correction and this on going correction is c wave of that 2nd wave which wil take us below march low OR a wave 1 of new bull market and this ongoing correction is wave 2 of a bull market …it would be really helpful if u can throw some light on it …..

    Reply
  5. Ramki on May 31, 2010 2:25 am

    Hi Kamlesh. My first advice is don’t read too many people. There are potentially as many counts there as there are analysts, at least in the minor waves. If your goal is to become an analyst,then start with a good text book and use this blog as a live reference. If you wish to be a trader or investor, seeking to make money from the market, then reading too many people and analysing their analysis leads you nowhere near the riches that you seek.

    Reply

Leave A Reply Cancel Reply

Recent Posts
  • Has Meta (Facebook) stock seen the bottom
  • What Is The Nearest Technical Support For Meta (NASDAQ: FB)
  • Using Elliott Waves to Capture a Trade in S&P500
  • Hedge Funds and Elliott Waves – Netflix $NFLX
  • When Elliott Waves applauds the promoter’s signals!

WaveTimes is a Research Organization dedicated to providing original analysis, reports, reviews, and insights on developments in mutual funds, stocks, investing, foreign exchange, commodities, and bonds.

Contact WaveTimes

L-601 Mantri Espana,

Kariyammana Agrahara, Bellandur, Bangalore 560103

Follow Us

  • Facebook
  • YouTube
  • Twitter

© 2023 Wave Times. All Rights Reserved.
  • About
  • Books
  • Privacy Policy
  • Policies and Standards

Type above and press Enter to search. Press Esc to cancel.