• About
  • Elliott Waves
    • Elliott Waves Explained
    • Elliott Wave Magic Illustrated with Wave Charts
    • Elliott Wave Edge – How Elliott Wave Traders Win
    • Fibonacci Number Series and Elliott Waves
    • How to use Fibonacci Ratio Retracements
    • Elliott Wave Books
      • The Elliott Wave Book – Five Waves to Financial Freedom
      • Dividend Growth Investing Using Elliott Waves
    • Videos
  • Equities
    • Indices
      • Africa
        • Egypt
      • Australia
      • European Indices
        • AEX – Index, Amsterdam
        • DAX Index
        • Istanbul
        • Russia
        • Spain’s IBEX 35
      • Asian Indices
        • India
        • China
        • Dubai
        • Kuwait
        • Kuala Lumpur
        • Pakistan
        • Saudi
        • Taiwan
      • US Indices
        • S&P500
        • Nasdaq
        • Dow Jones
        • Dow Jones Utilities
    • Stocks
      • Asian Stocks
        • Indian Stocks Trading
        • Dubai Stocks Outlook
        • Japanese Stocks
        • Kuwait stocks
        • Saudi Stocks Outlook
      • African Stocks
        • Egyptian Stocks
      • Swiss Stocks
      • Australian Stocks
      • European Stocks
      • US Stocks outlook
      • UK Stocks
  • Commodities
    • Copper
    • Gasoline
    • Gold
    • Natural Gas
    • Oil
    • Palm Oil
    • Raw Sugar
    • Rubber
    • Soybean Oil
    • Silver
  • Forex
    • AUD
    • Bitcoin
    • CAD
    • CHF
    • Euro
    • GBP
    • INR
    • NZD
    • JPY
  • Raves
  • Consulting
    • Consulting
  • Ramki’s Watchlist
Top News

Has Meta (Facebook) stock seen the bottom

March 21, 2022

What Is The Nearest Technical Support For Meta (NASDAQ: FB)

February 7, 2022

Using Elliott Waves to Capture a Trade in S&P500

January 27, 2022
Facebook Twitter Instagram
WaveTimes Blog WaveTimes Blog
Wave times
  • About
  • Elliott Waves
    • Elliott Waves Explained
    • Elliott Wave Magic Illustrated with Wave Charts
    • Elliott Wave Edge – How Elliott Wave Traders Win
    • Fibonacci Number Series and Elliott Waves
    • How to use Fibonacci Ratio Retracements
    • Elliott Wave Books
      • The Elliott Wave Book – Five Waves to Financial Freedom
      • Dividend Growth Investing Using Elliott Waves
    • Videos
  • Equities
    • Indices
      • Africa
        • Egypt
      • Australia
      • European Indices
        • AEX – Index, Amsterdam
        • DAX Index
        • Istanbul
        • Russia
        • Spain’s IBEX 35
      • Asian Indices
        • India
        • China
        • Dubai
        • Kuwait
        • Kuala Lumpur
        • Pakistan
        • Saudi
        • Taiwan
      • US Indices
        • S&P500
        • Nasdaq
        • Dow Jones
        • Dow Jones Utilities
    • Stocks
      • Asian Stocks
        • Indian Stocks Trading
        • Dubai Stocks Outlook
        • Japanese Stocks
        • Kuwait stocks
        • Saudi Stocks Outlook
      • African Stocks
        • Egyptian Stocks
      • Swiss Stocks
      • Australian Stocks
      • European Stocks
      • US Stocks outlook
      • UK Stocks
  • Commodities
    • Copper
    • Gasoline
    • Gold
    • Natural Gas
    • Oil
    • Palm Oil
    • Raw Sugar
    • Rubber
    • Soybean Oil
    • Silver
  • Forex
    • AUD
    • Bitcoin
    • CAD
    • CHF
    • Euro
    • GBP
    • INR
    • NZD
    • JPY
  • Raves
  • Consulting
    • Consulting
  • Ramki’s Watchlist
WaveTimes Blog WaveTimes Blog
Home » Elliott Wave analysis of Egypt’s Equity Index EGX30 September 2015
Africa

Elliott Wave analysis of Egypt’s Equity Index EGX30 September 2015

RamkiBy RamkiSeptember 5, 2015Updated:June 19, 202212 Comments2 Mins Read
Facebook Twitter LinkedIn Telegram Pinterest Tumblr Reddit WhatsApp Email
Share
Facebook Twitter LinkedIn Pinterest Email

Elliott Wave analysis works in all freely traded markets. The last time I offered you my Elliott Wave analysis of Egypt’s equity index, EGX30, it was back in August 2012. You can access that blog post by looking at the menu at the top of WaveTimes, under ‘Equities, Index, Africa, Egypt’.
You will see how we identified that the Egyptian index was likely to make significant gains. At that time, the index was trading at 5049. A lot of water has since flown down the Nile, but the Egyptian stock market almost doubled. I am sure a lot of investors made handsome profits in individual stocks.
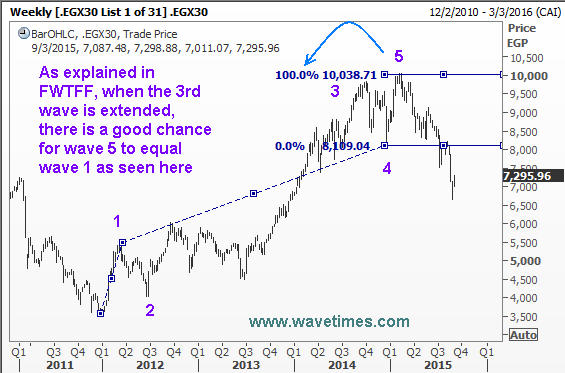
However, the inevitable Elliott Wave correction set in once the five wave cycle was completed. If you had read my book Elliott Wave book “Five Waves to Financial Freedom’ you will be able to spot how so many of the observations there has played out in the Egyptian Stock Index or EGX30 index.

In the following Elliott Wave charts, I demonstrate some of the salient points. Remember that this blog exists as a resource for the student of Elliott Waves. Whether you are a professional trader, a casual investor or a serious student of Elliott Waves, the examples available here will fascinate you and help you better understand the nature of financial markets and how you could anticipate the market turns. So without any further ado, present you the charts of the Egyptian Stock market index and how Elliott Wave analysis was so powerful in its play.

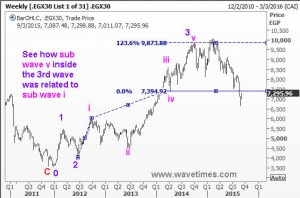
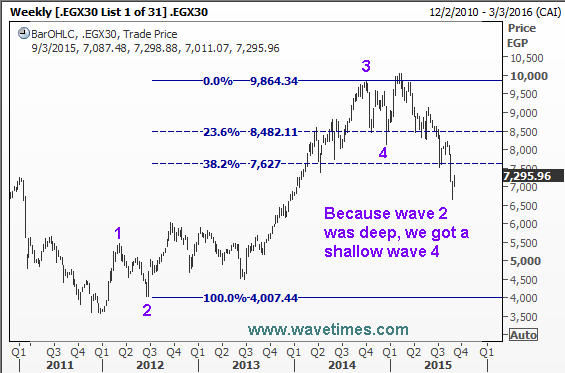
Egypt’s stock index traced an extended third wave


Observe how sub wave 5 inside the 3rd wave was equal to sub wave 1
wave 4 was shallow and came between 23.6% and 38.2% of wave 3
wave 5 was equal to wave 1
Once the 5 wave move ended, a huge correction started

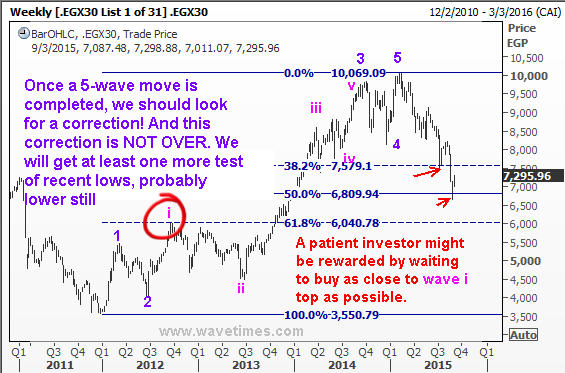
Now that you have seen how Elliott Waves work, go back to FWTFF and try and see if you could figure out the likely ending point of the on going correction. Good luck.

EGX30 Egypt Elliott Wave Equity Index
Share. Facebook Twitter Pinterest LinkedIn Tumblr Telegram Email
Previous ArticleNifty rallied up in 5 waves
Next Article Elliott Wave Analysis of WalMart
Ramki
  • Website

Related Posts

Using Elliott Waves to Capture a Trade in S&P500

January 27, 2022

SNP 500 Index in sideways move

November 7, 2020

How Elliott Waves helped WaveTimes members to exit before the stock market crash

March 27, 2020
View 12 Comments

12 Comments

  1. Crystal on September 6, 2015 6:00 pm

    Just asking for my learning purpose, could it be an A-B-C to the upside with 1 purple as the a of A, i pink as the c of A, and ii pink as B? Is there any clue why it isn’t the A-B-C I mentioned? Thanks.

    Reply
    • Ramki Ramakrishnan on September 9, 2015 7:43 pm

      HI Crystal, Once you have spent enough time with the book and the blog, you will come to realize a few things (a) There are always several wave counts possible and it comes to a judgment call at certain levels (b) Your count doesn’t have to be correct for you to make money, If it is going up, then you buy and vice versa. Good luck!

      Reply
  2. Vinay on September 8, 2015 10:24 pm

    Hi Sir, just completed reading your book five waves to financial freedom.Amazingly superb and simple ewp guide.I just wanted to know what is the minimum retrecment value for wave 2.

    Reply
    • Ramki Ramakrishnan on September 9, 2015 7:39 pm

      Vinay, There is no minimum retracement value for wave II, however, if you are able to look at the sub waves of the wave 1, and measure the sub wave 2 and sub wave 4, then the wave II will be bigger in size and last longer in time than either of the two sub waves. Hope that helps in establishing a minimum range!

      Reply
  3. gaurav on September 17, 2015 7:35 am

    Dear Ramki sir, thank you the post.
    Sir,whenever you have the time, can you please provide the break up of sub waves of wave v of 3 in purple ( i cant seem to come up with a good internal count of wave v of 3 as it doesnt seem to subdivide into a clear 5 wave structure ). Also sir, which is more important for an impulse wave a) to divide into clear 5 waves or b) obey most of rules guidelines and fibo relations?
    Regards
    Gaurav

    Reply
    • Ramki Ramakrishnan on October 4, 2015 6:59 pm

      Gaurav, Sometimes, it wont be possible to see the sub waves in a fast moving market. So don’t sweat on that. What matters is you need a framework to base your next trade on. As for your second question, I think getting more points of verification gives us confidence that we are on the right track. There is no such thing as which is more important. Also remember that Fibo relationships are only tools for verification. On the other hand, seeing a 5-wave more is generally more important, in my view.

      Reply
    • prabh on October 5, 2015 6:18 am

      Gaurav,

      If somebody wants to have to see internal waves of Wave 5,then its best to drill down to lower time frame for e.g Hourly or 15 Min.

      Reply
  4. Vinay on September 18, 2015 7:36 pm

    Sir,
    Is it possible for sub wave 1 of fifth to have positive gaps,also when fifth is extended then is is possible for wave 3 is 161.8% of wave 1,in which case guidelines of equality is not respected.

    Reply
    • Ramki Ramakrishnan on October 4, 2015 6:54 pm

      Vinay, Yes, it is indeed possible for sub wave 1 of the fifth to have positive gaps. As for the guideline of equality, it is only a guideline and not a rule. So nothing is violated if you don’t see equality between any two impulse waves in a 5-wave sequence.

      Reply
  5. Ben on September 20, 2015 7:27 pm

    Hi,
    I just read your book and I have to say your book is very easy to understand. I will recommend my friends who want to learn how to invest for sure. By the way, I have questions about the wave form. Is it possible to have this kind of wave form; extended wave 1, complex correction wave 2 (double zigzag), normal wave 3 (138.2%) and then complex correction wave 4 (irregular flat and flat).
    Since wave 4 is complex correction, is it possible that wave 5 will be extended again (since wave 1 was extend)?
    Thank you

    Reply
    • Ramki Ramakrishnan on October 4, 2015 6:51 pm

      Ben, Good question. Start by understanding that just about anything is possible in the market. We need 5 waves up. Usually only 1 wave extends, but often enough, we can see two extensions. There is no rule that says we cannot have 2 complex corrections. But again, the general tendency is for alternation, ie if one is complex, the other is simple. In general, we should think the waves will unfold in a normal way. But being prepared allows one to take action should something else start to unfold.

      Reply
  6. gaurav on September 28, 2015 8:19 am

    Dear Ramki sir, my earlier response has not been posted. I am wondering if i posted something wrong or violated a rule ?
    Regards
    Gaurav

    Reply

Leave A Reply Cancel Reply

Recent Posts
  • Has Meta (Facebook) stock seen the bottom
  • What Is The Nearest Technical Support For Meta (NASDAQ: FB)
  • Using Elliott Waves to Capture a Trade in S&P500
  • Hedge Funds and Elliott Waves – Netflix $NFLX
  • When Elliott Waves applauds the promoter’s signals!

WaveTimes is a Research Organization dedicated to providing original analysis, reports, reviews, and insights on developments in mutual funds, stocks, investing, foreign exchange, commodities, and bonds.

Contact WaveTimes

L-601 Mantri Espana,

Kariyammana Agrahara, Bellandur, Bangalore 560103

Follow Us

  • Facebook
  • YouTube
  • Twitter

© 2023 Wave Times. All Rights Reserved.
  • About
  • Books
  • Privacy Policy
  • Policies and Standards

Type above and press Enter to search. Press Esc to cancel.