• About
  • Elliott Waves
    • Elliott Waves Explained
    • Elliott Wave Magic Illustrated with Wave Charts
    • Elliott Wave Edge – How Elliott Wave Traders Win
    • Fibonacci Number Series and Elliott Waves
    • How to use Fibonacci Ratio Retracements
    • Elliott Wave Books
      • The Elliott Wave Book – Five Waves to Financial Freedom
      • Dividend Growth Investing Using Elliott Waves
    • Videos
  • Equities
    • Indices
      • Africa
        • Egypt
      • Australia
      • European Indices
        • AEX – Index, Amsterdam
        • DAX Index
        • Istanbul
        • Russia
        • Spain’s IBEX 35
      • Asian Indices
        • India
        • China
        • Dubai
        • Kuwait
        • Kuala Lumpur
        • Pakistan
        • Saudi
        • Taiwan
      • US Indices
        • S&P500
        • Nasdaq
        • Dow Jones
        • Dow Jones Utilities
    • Stocks
      • Asian Stocks
        • Indian Stocks Trading
        • Dubai Stocks Outlook
        • Japanese Stocks
        • Kuwait stocks
        • Saudi Stocks Outlook
      • African Stocks
        • Egyptian Stocks
      • Swiss Stocks
      • Australian Stocks
      • European Stocks
      • US Stocks outlook
      • UK Stocks
  • Commodities
    • Copper
    • Gasoline
    • Gold
    • Natural Gas
    • Oil
    • Palm Oil
    • Raw Sugar
    • Rubber
    • Soybean Oil
    • Silver
  • Forex
    • AUD
    • Bitcoin
    • CAD
    • CHF
    • Euro
    • GBP
    • INR
    • NZD
    • JPY
  • Raves
  • Consulting
    • Consulting
  • Ramki’s Watchlist
Top News

Has Meta (Facebook) stock seen the bottom

March 21, 2022

What Is The Nearest Technical Support For Meta (NASDAQ: FB)

February 7, 2022

Using Elliott Waves to Capture a Trade in S&P500

January 27, 2022
Facebook Twitter Instagram
WaveTimes Blog WaveTimes Blog
Wave times
  • About
  • Elliott Waves
    • Elliott Waves Explained
    • Elliott Wave Magic Illustrated with Wave Charts
    • Elliott Wave Edge – How Elliott Wave Traders Win
    • Fibonacci Number Series and Elliott Waves
    • How to use Fibonacci Ratio Retracements
    • Elliott Wave Books
      • The Elliott Wave Book – Five Waves to Financial Freedom
      • Dividend Growth Investing Using Elliott Waves
    • Videos
  • Equities
    • Indices
      • Africa
        • Egypt
      • Australia
      • European Indices
        • AEX – Index, Amsterdam
        • DAX Index
        • Istanbul
        • Russia
        • Spain’s IBEX 35
      • Asian Indices
        • India
        • China
        • Dubai
        • Kuwait
        • Kuala Lumpur
        • Pakistan
        • Saudi
        • Taiwan
      • US Indices
        • S&P500
        • Nasdaq
        • Dow Jones
        • Dow Jones Utilities
    • Stocks
      • Asian Stocks
        • Indian Stocks Trading
        • Dubai Stocks Outlook
        • Japanese Stocks
        • Kuwait stocks
        • Saudi Stocks Outlook
      • African Stocks
        • Egyptian Stocks
      • Swiss Stocks
      • Australian Stocks
      • European Stocks
      • US Stocks outlook
      • UK Stocks
  • Commodities
    • Copper
    • Gasoline
    • Gold
    • Natural Gas
    • Oil
    • Palm Oil
    • Raw Sugar
    • Rubber
    • Soybean Oil
    • Silver
  • Forex
    • AUD
    • Bitcoin
    • CAD
    • CHF
    • Euro
    • GBP
    • INR
    • NZD
    • JPY
  • Raves
  • Consulting
    • Consulting
  • Ramki’s Watchlist
WaveTimes Blog WaveTimes Blog
Home » Elliott Wave Analysis of Egypt's EGX30 Index
Egypt

Elliott Wave Analysis of Egypt's EGX30 Index

RamkiBy RamkiAugust 7, 201217 Comments2 Mins Read
Facebook Twitter LinkedIn Telegram Pinterest Tumblr Reddit WhatsApp Email
Share
Facebook Twitter LinkedIn Pinterest Email

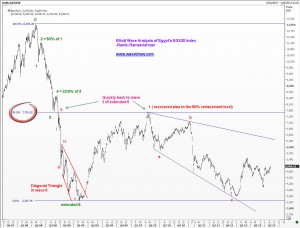
Is it possible to do an Elliott Wave Analysis of Egypt’s EGX30 index? Yes, of course. Take a look at the attached chart. You can see clearly that the second wave retraced wave 1 by 50%. That was followed by the third wave travelling just a shade over 161.8% of wave 1. We then got a 23.6% correction as wave 4, an early warning that wave 5 was likely to extend because the first wave and third wave were normal in size. Sure enough, the fifth wave travelled over 123.6% of the distance from points 0 to 3. Interestingly, the fifth wave finished with a diagonal triangle, a typical pattern that signals the end of a major move. Also, you can see the fifth wave is made up of 5 minor waves. The diagional itself has 5 tiny waves inside it. Everything fits perfectly into what Ralph Nelson Elliott told us to look for! Remember what I explained in my book “Five Waves to Financial Freedom”, that when we see an extended fifth wave finish, we should get ready for a speedy recovery back to wave 2 within the fifth wave. Look what happened with Egypt’s EGX30 index! Once the extended fifth wave was completed, we got a fairly quick move back to the second wave within the fifth wave. It always works like magic! Let us call that recovery wave 1.
Elliott Wave Analysis of Egypt's EGX30 index
Elliott Wave Analysis of Egypt’s EGX30 index
The subsequent correction should be made up of 3 waves, and this looks like its finished that too. That means we should get ready for a third wave move higher, unless the second wave itself was going to become a complex correction. Our clue will be with the speed of the rally. If we don’t get started soon on the upside, we will have to reckon with one more test downside, but as of now, the index looks positive. I think any swift move above the 5700 will encourage the bulls. Good luck.

EGX30 Egypt Stock Index
Share. Facebook Twitter Pinterest LinkedIn Tumblr Telegram Email
Previous ArticleElliott Wave update on German Dax Index: Aug 2012
Next Article Why Forex Traders Tend To Lose Money
Ramki
  • Website

Related Posts

Elliott Wave analysis of Egypt’s Equity Index EGX30 September 2015

September 5, 2015
View 17 Comments

17 Comments

  1. hadi_Soliman on August 8, 2012 4:48 am

    OEW always just simple and plain with you Dear Ramki Sir!!
    hope third wave will start soon so as to recover losses i made before being introduced to EW planet through your beautiful website.
    You always know the name of the game)))) All the Best!!

    Reply
  2. Anderson Soffa on August 8, 2012 6:03 am

    Great analysis Ramki Sir, I bought your book on Amazon and have to say that was one of the best trades that I did this year.
    I’m not meant to abuse your good will, but could you please do the same analysis for the brazilian stock index, IBovespa?
    Thanks in advance, and hoping for your next book.

    Reply
    • Ramki Ramakrishnan on August 8, 2012 11:50 pm

      Anderson, Thanks. Will check out IBovespa when I get some spare time

      Reply
  3. basem on August 8, 2012 4:30 pm

    Hi Ramki,
    There is something I am not clear about. we have bearish 5 wave count then ABC which is supposed to correct the bearish 5 wave count, how can C be lower than A? I thought C should be higher than A so we can have a correction.

    Thanks

    Basem

    Reply
    • Ramki Ramakrishnan on August 9, 2012 12:06 am

      Hi Basem, Thats a great question and I am glad you asked it. Can a correction be made up of 5 waves? ie the move from 12000 to 3367. No. According to EWP, all corrections are made up of 3 waves. The A wave could be 5 waves if this is a zigzag. That means either my wave count is wrong for teh 5 waves down, or that move was wave A. Leaving that aside, the recovery to 7800 shoudl be labelled as wave A of a bigger ABC correction. So we will get a C wave higher and then we will see a bigger sell off to complete the bigger C wave. All that is in the Big Picture and by next week, most of us would have forgotten what i have written. So who cares about the big picture? WHat you need to learn now is irrespective of the big picture, you could have traded the whole move down from 12000 by assuming this was a 5 wave downmove. Likelwise, whether the rally to 7800 is a wave 1 or wave A, the next big move will be HIGHER, either as wave 3 or wave C. And it will have 5 minor waves. Go and trade that when the move starts. Forget about the big picture. Use Elliott to profit, to give you an advantage, a trading edge. Good luck. PS for all the others reading this response, I hope you start looking at the markets the way WaveTimes is teaching you to. That way, you will cease to be arm chair analysts, and become traders.

      Reply
    • nadir236 on August 9, 2012 3:07 am

      if i may reply, the 5 waves down is wave A. the pattern above corrected a previous 5 wave bull market not seen on the charts. best regards, nadir

      Reply
  4. jayesh on August 8, 2012 7:48 pm

    sir some update on euro and chf if possible.

    Reply
  5. nadir236 on August 9, 2012 4:30 am

    mr. ramki, i have read that corrections come in 3 waves. the wave labeled 1 must have been a typo when you actually meant to label it as wave B. sincereley, nadir

    Reply
    • Ramki Ramakrishnan on August 11, 2012 10:58 pm

      Hi Nadir, you are correct in stating that corrections come in 3 waves. Bear in mind also that ALL wave counting are ‘tentative’ until the move is over. We should have teh flexibility to re-label the waves as the moves unfold. Good luck.

      Reply
  6. RX on August 13, 2012 11:53 am

    it looks like your bearish count on S&P is absolutely wrong.

    Reply
    • Ramki Ramakrishnan on August 14, 2012 5:24 am

      Hi RX, Thank you for writing. I have been wrong on a few others too….however, it is not whether a particular analysis is right or wrong that is important. Anyone can be right or wrong. My approach to the markets is to have a view, and then work on it to time a trade that has an attractive risk-reward trade off.

      Reply
  7. leeferns on August 20, 2012 8:54 am

    Dear Sir,

    I would like to thank you for the low pricing of the book. I
    have purchased it a month back and it has completely changed the way I look at
    charts

    I also read that corrections should be ABC so in this chart
    of EGX30 Index, I wondered whether
    the entire move from 0-5 can be labelled as (A) as mentioned by Nadir below and after the third move up, then
    we should get a bigger (C) wave down OR

    The 0-5 wave can also be counted as an entire ABC correction
    and the third move up should be looked upon as the intermediate of a new 0-5
    wave. I am asking this question as this chart is quite similar to the chart of
    SBI (State Bank of India)

    I would be happy if any of our readers could answer in case
    Ramki Sir is busy.
    Thanks,leeferns

    Reply
    • nadir236 on August 21, 2012 3:12 am

      i’m unable to read mr ramki’s comment. all i can see on the right side column is “hi nadir, you are…” item 34810? if someone is able to read it, please post it below i would be most grateful.

      leeferns, it looks like the correction is over. we have an impulse wave A (0-5), B wave (labeled 1 on chart) retracing 50% of A and finally a C wave (labeled abc on chart) ending diagonal (bullish falling wedge). the C wave retraced less than 61.8% of A so it was a failure which means very bullish. new bull cycle starting.

      Reply
      • leeferns on August 22, 2012 11:21 pm

        Thanks Nadir. Sorry even I am unable to read the comments on the right column

        Reply
      • Ramki Ramakrishnan on August 23, 2012 7:36 am

        Nadir, I am not sure why my reply doesn’t show up..this is what I had said. “Hi Nadir, you are correct in stating that corrections come in 3 waves. Bear in mind also that ALL wave counting are ‘tentative’ until the move is over. We should have teh flexibility to re-label the waves as the moves unfold. Good luck.”

        Reply
  8. Corrinne Cortin on August 22, 2012 1:58 pm

    Dear Sir,
    It’s possible an analysis for Gold?
    Thank you, Sir

    Reply
  9. A S on June 19, 2013 7:12 pm

    Dear mr Ramki

    Is it possible for a new analysis for the egx30

    Thanks a lot

    Reply

Leave A Reply Cancel Reply

Recent Posts
  • Has Meta (Facebook) stock seen the bottom
  • What Is The Nearest Technical Support For Meta (NASDAQ: FB)
  • Using Elliott Waves to Capture a Trade in S&P500
  • Hedge Funds and Elliott Waves – Netflix $NFLX
  • When Elliott Waves applauds the promoter’s signals!

WaveTimes is a Research Organization dedicated to providing original analysis, reports, reviews, and insights on developments in mutual funds, stocks, investing, foreign exchange, commodities, and bonds.

Contact WaveTimes

L-601 Mantri Espana,

Kariyammana Agrahara, Bellandur, Bangalore 560103

Follow Us

  • Facebook
  • YouTube
  • Twitter

© 2023 Wave Times. All Rights Reserved.
  • About
  • Books
  • Privacy Policy
  • Policies and Standards

Type above and press Enter to search. Press Esc to cancel.