• About
  • Elliott Waves
    • Elliott Waves Explained
    • Elliott Wave Magic Illustrated with Wave Charts
    • Elliott Wave Edge – How Elliott Wave Traders Win
    • Fibonacci Number Series and Elliott Waves
    • How to use Fibonacci Ratio Retracements
    • Elliott Wave Books
      • The Elliott Wave Book – Five Waves to Financial Freedom
      • Dividend Growth Investing Using Elliott Waves
    • Videos
  • Equities
    • Indices
      • Africa
        • Egypt
      • Australia
      • European Indices
        • AEX – Index, Amsterdam
        • DAX Index
        • Istanbul
        • Russia
        • Spain’s IBEX 35
      • Asian Indices
        • India
        • China
        • Dubai
        • Kuwait
        • Kuala Lumpur
        • Pakistan
        • Saudi
        • Taiwan
      • US Indices
        • S&P500
        • Nasdaq
        • Dow Jones
        • Dow Jones Utilities
    • Stocks
      • Asian Stocks
        • Indian Stocks Trading
        • Dubai Stocks Outlook
        • Japanese Stocks
        • Kuwait stocks
        • Saudi Stocks Outlook
      • African Stocks
        • Egyptian Stocks
      • Swiss Stocks
      • Australian Stocks
      • European Stocks
      • US Stocks outlook
      • UK Stocks
  • Commodities
    • Copper
    • Gasoline
    • Gold
    • Natural Gas
    • Oil
    • Palm Oil
    • Raw Sugar
    • Rubber
    • Soybean Oil
    • Silver
  • Forex
    • AUD
    • Bitcoin
    • CAD
    • CHF
    • Euro
    • GBP
    • INR
    • NZD
    • JPY
  • Raves
  • Consulting
    • Consulting
  • Ramki’s Watchlist
Top News

Has Meta (Facebook) stock seen the bottom

March 21, 2022

What Is The Nearest Technical Support For Meta (NASDAQ: FB)

February 7, 2022

Using Elliott Waves to Capture a Trade in S&P500

January 27, 2022
Facebook Twitter Instagram
WaveTimes Blog WaveTimes Blog
Wave times
  • About
  • Elliott Waves
    • Elliott Waves Explained
    • Elliott Wave Magic Illustrated with Wave Charts
    • Elliott Wave Edge – How Elliott Wave Traders Win
    • Fibonacci Number Series and Elliott Waves
    • How to use Fibonacci Ratio Retracements
    • Elliott Wave Books
      • The Elliott Wave Book – Five Waves to Financial Freedom
      • Dividend Growth Investing Using Elliott Waves
    • Videos
  • Equities
    • Indices
      • Africa
        • Egypt
      • Australia
      • European Indices
        • AEX – Index, Amsterdam
        • DAX Index
        • Istanbul
        • Russia
        • Spain’s IBEX 35
      • Asian Indices
        • India
        • China
        • Dubai
        • Kuwait
        • Kuala Lumpur
        • Pakistan
        • Saudi
        • Taiwan
      • US Indices
        • S&P500
        • Nasdaq
        • Dow Jones
        • Dow Jones Utilities
    • Stocks
      • Asian Stocks
        • Indian Stocks Trading
        • Dubai Stocks Outlook
        • Japanese Stocks
        • Kuwait stocks
        • Saudi Stocks Outlook
      • African Stocks
        • Egyptian Stocks
      • Swiss Stocks
      • Australian Stocks
      • European Stocks
      • US Stocks outlook
      • UK Stocks
  • Commodities
    • Copper
    • Gasoline
    • Gold
    • Natural Gas
    • Oil
    • Palm Oil
    • Raw Sugar
    • Rubber
    • Soybean Oil
    • Silver
  • Forex
    • AUD
    • Bitcoin
    • CAD
    • CHF
    • Euro
    • GBP
    • INR
    • NZD
    • JPY
  • Raves
  • Consulting
    • Consulting
  • Ramki’s Watchlist
WaveTimes Blog WaveTimes Blog
Home » Elliott Wave Analysis of Dubai Stock Index
Dubai

Elliott Wave Analysis of Dubai Stock Index

RamkiBy RamkiSeptember 12, 20138 Comments2 Mins Read
Facebook Twitter LinkedIn Telegram Pinterest Tumblr Reddit WhatsApp Email
Share
Facebook Twitter LinkedIn Pinterest Email

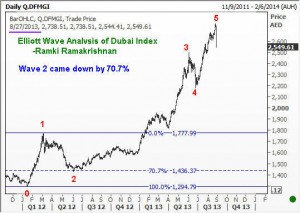
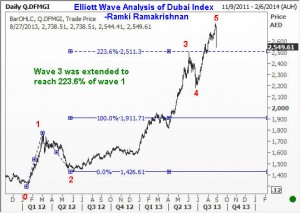
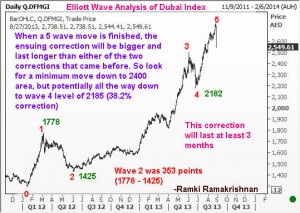
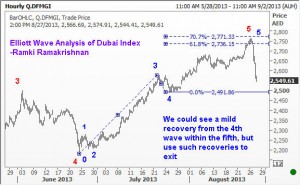
Hello Traders from the Middle East. So Dubai Stock index, or the DFM Index, has collapsed today, losing over 7%. Shocking, but the writing was on the wall all along. With the increase in rhetoric about Syria, we just needed a small push and it would have fallen over the cliff! When a move is approaching the end of its 5th wave, any informed investor would have sold off all his shares and waited for the inevitable correction to start. Elliott Wave Analysis of Dubai Stock Index shows that the 5th wave has indeed been completed. a fact that has become evident today, but something we should have anticipated. You can observe from the Elliott Wave charts attached that Dubai index had earlier seen an extended third wave. When you already have an extension in either the first wave or third wave, you should expect the fifth wave to be of normal proportions. Finally, by examining the sub waves of the fifth wave, you could have gotten out of most of your investments close to the top. This is shown in the last chart below. What is the outlook for Dubai Index from here? Well, there are mild supports at the fourth wave level within the just completed fifth wave.But expect any recovery to be mild and short lived. We should choose to exit on a pull back, waiting for the next bull market to be signaled by Elliott Waves sometime in the future.

DFM Dubai stock index
Share. Facebook Twitter Pinterest LinkedIn Tumblr Telegram Email
Previous ArticleElliott Wave Analysis of BHEL
Next Article Fifth wave or third wave top – a tough choice
Ramki
  • Website

Related Posts

Elliott Wave Analysis of Dubai Stock Index (DFM Gen Index)

April 12, 2013

Elliott Wave Analysis of EMAR

November 13, 2011

Elliott Wave Counting of Dubai Financial Market Index

September 7, 2011
View 8 Comments

8 Comments

  1. JDXB on September 14, 2013 12:29 pm

    question:
    Are we finished the main ABC correction which we say that (A) was at 2358 and (b) at 2620 and (C) at 2299 ? or we still have more up coming down trend correction which we say (A) wave at 2299 and (B) will be almost 2730 and (C) between 2200 and 1800?

    Reply
    • Ramki Ramakrishnan on September 17, 2013 6:52 pm

      JDXB, I wonder if you have read my book FWTFF? If you get a 3 wave correction that seems to be incomplete, and you think that was just an A wave, then the ensuing B wave should be in 3 waves taking it back near the start of the A wave….you clue then is the composition of the B wave, and where you expect it to finish, and you will watch the reaction at the top of the B wave. If the down move from there looks aggressive, perhaps we are going to witness a C wave down. If it is slow, then that will be wave 4 inside a new impulse wave from 2299

      Reply
      • DFMDXB on September 19, 2013 4:01 am

        Hi Ramki,

        So, basically If we assume the impulse wave from 2299-2673 is B of ABC correction, the. B should be only three waves (which is the case till now).

        Then if we breakout upward the point 2673 that means the correction completed at 2299, and we intered the wave 3 of 1 of 3 which should target at least 3200-4400 depend if it is extended or not!!

        Does this correct?!

        Reply
        • Ramki Ramakrishnan on September 23, 2013 4:07 pm

          DFMDXB, let us start with the assumption that just about anything can happen. All we can do is to start our count from a significant low or high and position ourselves at low risk entry points.

          Reply
  2. essa on October 4, 2013 5:37 pm

    Hi Mr: Ramki

    Is Elliott count is still the same or got changed numbering

    Accept greetings

    Reply
    • essa on December 27, 2013 5:11 pm

      Hi Mr: Ramki

      Is Elliott count is still the same or got changed numbering

      Accept greetings

      Reply
      • Ramki Ramakrishnan on January 1, 2014 5:59 pm

        Essa, thanks and all the best for 2014

        Reply
        • essa on May 3, 2014 1:10 am

          Hello Mr. Ramki
          Is it time to update and supplement numbering Dubai Financial Market

          Warm Regards

          Reply

Leave A Reply Cancel Reply

Recent Posts
  • Has Meta (Facebook) stock seen the bottom
  • What Is The Nearest Technical Support For Meta (NASDAQ: FB)
  • Using Elliott Waves to Capture a Trade in S&P500
  • Hedge Funds and Elliott Waves – Netflix $NFLX
  • When Elliott Waves applauds the promoter’s signals!

WaveTimes is a Research Organization dedicated to providing original analysis, reports, reviews, and insights on developments in mutual funds, stocks, investing, foreign exchange, commodities, and bonds.

Contact WaveTimes

L-601 Mantri Espana,

Kariyammana Agrahara, Bellandur, Bangalore 560103

Follow Us

  • Facebook
  • YouTube
  • Twitter

© 2022 Wave Times. All Rights Reserved.
  • About
  • Books
  • Privacy Policy
  • Policies and Standards

Type above and press Enter to search. Press Esc to cancel.