• About
  • Elliott Waves
    • Elliott Waves Explained
    • Elliott Wave Magic Illustrated with Wave Charts
    • Elliott Wave Edge – How Elliott Wave Traders Win
    • Fibonacci Number Series and Elliott Waves
    • How to use Fibonacci Ratio Retracements
    • Elliott Wave Books
      • The Elliott Wave Book – Five Waves to Financial Freedom
      • Dividend Growth Investing Using Elliott Waves
    • Videos
  • Equities
    • Indices
      • Africa
        • Egypt
      • Australia
      • European Indices
        • AEX – Index, Amsterdam
        • DAX Index
        • Istanbul
        • Russia
        • Spain’s IBEX 35
      • Asian Indices
        • India
        • China
        • Dubai
        • Kuwait
        • Kuala Lumpur
        • Pakistan
        • Saudi
        • Taiwan
      • US Indices
        • S&P500
        • Nasdaq
        • Dow Jones
        • Dow Jones Utilities
    • Stocks
      • Asian Stocks
        • Indian Stocks Trading
        • Dubai Stocks Outlook
        • Japanese Stocks
        • Kuwait stocks
        • Saudi Stocks Outlook
      • African Stocks
        • Egyptian Stocks
      • Swiss Stocks
      • Australian Stocks
      • European Stocks
      • US Stocks outlook
      • UK Stocks
  • Commodities
    • Copper
    • Gasoline
    • Gold
    • Natural Gas
    • Oil
    • Palm Oil
    • Raw Sugar
    • Rubber
    • Soybean Oil
    • Silver
  • Forex
    • AUD
    • Bitcoin
    • CAD
    • CHF
    • Euro
    • GBP
    • INR
    • NZD
    • JPY
  • Raves
  • Consulting
    • Consulting
  • Ramki’s Watchlist
Top News

Has Meta (Facebook) stock seen the bottom

March 21, 2022

What Is The Nearest Technical Support For Meta (NASDAQ: FB)

February 7, 2022

Using Elliott Waves to Capture a Trade in S&P500

January 27, 2022
Facebook Twitter Instagram
WaveTimes Blog WaveTimes Blog
Wave times
  • About
  • Elliott Waves
    • Elliott Waves Explained
    • Elliott Wave Magic Illustrated with Wave Charts
    • Elliott Wave Edge – How Elliott Wave Traders Win
    • Fibonacci Number Series and Elliott Waves
    • How to use Fibonacci Ratio Retracements
    • Elliott Wave Books
      • The Elliott Wave Book – Five Waves to Financial Freedom
      • Dividend Growth Investing Using Elliott Waves
    • Videos
  • Equities
    • Indices
      • Africa
        • Egypt
      • Australia
      • European Indices
        • AEX – Index, Amsterdam
        • DAX Index
        • Istanbul
        • Russia
        • Spain’s IBEX 35
      • Asian Indices
        • India
        • China
        • Dubai
        • Kuwait
        • Kuala Lumpur
        • Pakistan
        • Saudi
        • Taiwan
      • US Indices
        • S&P500
        • Nasdaq
        • Dow Jones
        • Dow Jones Utilities
    • Stocks
      • Asian Stocks
        • Indian Stocks Trading
        • Dubai Stocks Outlook
        • Japanese Stocks
        • Kuwait stocks
        • Saudi Stocks Outlook
      • African Stocks
        • Egyptian Stocks
      • Swiss Stocks
      • Australian Stocks
      • European Stocks
      • US Stocks outlook
      • UK Stocks
  • Commodities
    • Copper
    • Gasoline
    • Gold
    • Natural Gas
    • Oil
    • Palm Oil
    • Raw Sugar
    • Rubber
    • Soybean Oil
    • Silver
  • Forex
    • AUD
    • Bitcoin
    • CAD
    • CHF
    • Euro
    • GBP
    • INR
    • NZD
    • JPY
  • Raves
  • Consulting
    • Consulting
  • Ramki’s Watchlist
WaveTimes Blog WaveTimes Blog
Home » Elliott Wave Analysis of Dubai Stock Index (DFM Gen Index)
Dubai

Elliott Wave Analysis of Dubai Stock Index (DFM Gen Index)

RamkiBy RamkiApril 12, 20135 Comments1 Min Read
Facebook Twitter LinkedIn Telegram Pinterest Tumblr Reddit WhatsApp Email
Share
Facebook Twitter LinkedIn Pinterest Email

This blog aims to teach traders how to use Elliott Wave analysis in their trading. A variety of markets are covered to demonstrate that the principle works just as well in any of them. Whether you are a short term trader, or a medium term investor, you will find that this approach will add considerable value to your bottom line. Everything in this blog is for free. Every chart presented was done with a forward looking approach. Wave Times is different because I make no pretense that I know it all. However, I do know that a trader can make sensible trading decisions by using these techniques. Go ahead, and check it out yourself. These comments reach a few thousand enthusiasts. If this is your first time here, welcome aboard.

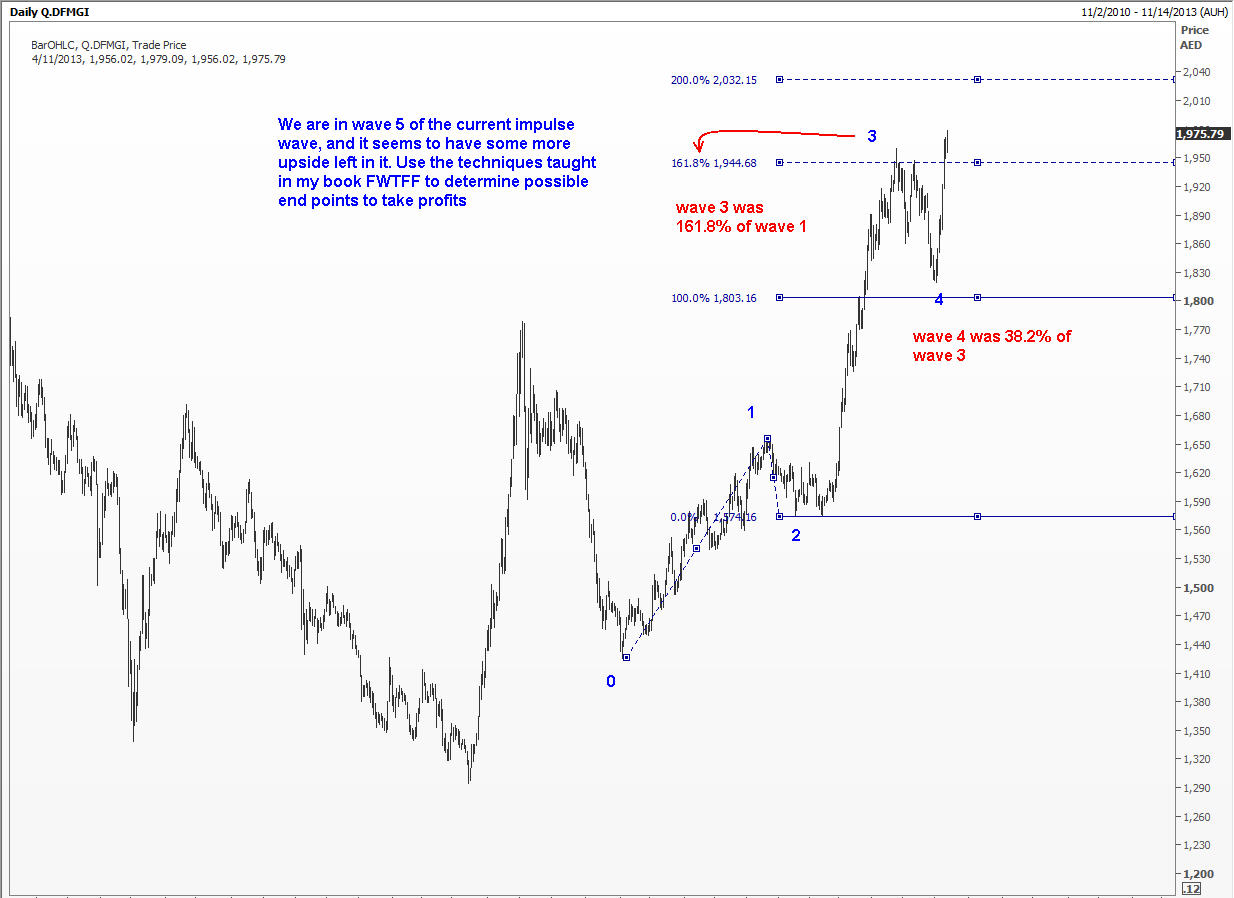
Today, I present you with a quick chart of the Dubai Stock Index. I am giving you a clue. Because the 2 impulse waves are normal, the fifth wave could potentially become an extended wave. However, you should also relate the current impulse wave to the measure of the prior impulse wave to see if you can find some relationships. Go ahead, and test yourself.

Best of luck.

DFMGI12apr13

DFM
Share. Facebook Twitter Pinterest LinkedIn Tumblr Telegram Email
Previous ArticleElliott Wave Analysis of Infosys Ltd (INFY)
Next Article Elliott Wave Analysis of Gold
Ramki
  • Website

Related Posts

Elliott Wave Analysis of Dubai Stock Index

September 12, 2013

Elliott Wave Analysis of EMAR

November 13, 2011

Elliott Wave Counting of Dubai Financial Market Index

September 7, 2011
View 5 Comments

5 Comments

  1. Fadel on April 18, 2013 9:47 pm

    Thanks for the chart for dfm, a market that I follow.
    I only notice the wave numbered “1”, its intenal waves are overlapping with each other. That make it difficult to give it 5 wave internaly with each wave 2&4 not overlapping.

    Reply
    • Ramki Ramakrishnan on April 21, 2013 9:18 pm

      Hi Fadel, when wave 1 develops as a leading diagonal, there will be overlaps within its subwaves.

      Reply
  2. ali on April 23, 2013 6:44 pm

    wave (3) is the longest implse wave . therefor wave (5) approximates wave (1) .Wave (2) is flat, Wave (4) is sharp. target will be around 2050-2060.. correct me if am wrong : )

    Reply
  3. ali on May 13, 2013 3:45 pm

    mr. ramki …dfmgi reach today (high point) 2200!! any correction coming ahead?

    Reply
  4. Imran on June 5, 2018 3:44 am

    Ramki,

    It might be time to revisit the DFMGI, been a while 😀

    I see a complex correction in Wave II completed in the DFMGI

    Flat in the Wave A or W
    Irregular Wave B or X
    Zigzag in the Wave C or Y

    If I followed the FWTFF correctly then the timing and the retracement of this Wave II has taken longer and deeper of the Wave 2 and Wave 4 of the previous Wave I.

    /Imran

    Reply

Leave A Reply Cancel Reply

Recent Posts
  • Has Meta (Facebook) stock seen the bottom
  • What Is The Nearest Technical Support For Meta (NASDAQ: FB)
  • Using Elliott Waves to Capture a Trade in S&P500
  • Hedge Funds and Elliott Waves – Netflix $NFLX
  • When Elliott Waves applauds the promoter’s signals!

WaveTimes is a Research Organization dedicated to providing original analysis, reports, reviews, and insights on developments in mutual funds, stocks, investing, foreign exchange, commodities, and bonds.

Contact WaveTimes

L-601 Mantri Espana,

Kariyammana Agrahara, Bellandur, Bangalore 560103

Follow Us

  • Facebook
  • YouTube
  • Twitter

© 2023 Wave Times. All Rights Reserved.
  • About
  • Books
  • Privacy Policy
  • Policies and Standards

Type above and press Enter to search. Press Esc to cancel.