• About
  • Elliott Waves
    • Elliott Waves Explained
    • Elliott Wave Magic Illustrated with Wave Charts
    • Elliott Wave Edge – How Elliott Wave Traders Win
    • Fibonacci Number Series and Elliott Waves
    • How to use Fibonacci Ratio Retracements
    • Elliott Wave Books
      • The Elliott Wave Book – Five Waves to Financial Freedom
      • Dividend Growth Investing Using Elliott Waves
    • Videos
  • Equities
    • Indices
      • Africa
        • Egypt
      • Australia
      • European Indices
        • AEX – Index, Amsterdam
        • DAX Index
        • Istanbul
        • Russia
        • Spain’s IBEX 35
      • Asian Indices
        • India
        • China
        • Dubai
        • Kuwait
        • Kuala Lumpur
        • Pakistan
        • Saudi
        • Taiwan
      • US Indices
        • S&P500
        • Nasdaq
        • Dow Jones
        • Dow Jones Utilities
    • Stocks
      • Asian Stocks
        • Indian Stocks Trading
        • Dubai Stocks Outlook
        • Japanese Stocks
        • Kuwait stocks
        • Saudi Stocks Outlook
      • African Stocks
        • Egyptian Stocks
      • Swiss Stocks
      • Australian Stocks
      • European Stocks
      • US Stocks outlook
      • UK Stocks
  • Commodities
    • Copper
    • Gasoline
    • Gold
    • Natural Gas
    • Oil
    • Palm Oil
    • Raw Sugar
    • Rubber
    • Soybean Oil
    • Silver
  • Forex
    • AUD
    • Bitcoin
    • CAD
    • CHF
    • Euro
    • GBP
    • INR
    • NZD
    • JPY
  • Raves
  • Consulting
    • Consulting
  • Ramki’s Watchlist
Top News

Has Meta (Facebook) stock seen the bottom

March 21, 2022

What Is The Nearest Technical Support For Meta (NASDAQ: FB)

February 7, 2022

Using Elliott Waves to Capture a Trade in S&P500

January 27, 2022
Facebook Twitter Instagram
WaveTimes Blog WaveTimes Blog
Wave times
  • About
  • Elliott Waves
    • Elliott Waves Explained
    • Elliott Wave Magic Illustrated with Wave Charts
    • Elliott Wave Edge – How Elliott Wave Traders Win
    • Fibonacci Number Series and Elliott Waves
    • How to use Fibonacci Ratio Retracements
    • Elliott Wave Books
      • The Elliott Wave Book – Five Waves to Financial Freedom
      • Dividend Growth Investing Using Elliott Waves
    • Videos
  • Equities
    • Indices
      • Africa
        • Egypt
      • Australia
      • European Indices
        • AEX – Index, Amsterdam
        • DAX Index
        • Istanbul
        • Russia
        • Spain’s IBEX 35
      • Asian Indices
        • India
        • China
        • Dubai
        • Kuwait
        • Kuala Lumpur
        • Pakistan
        • Saudi
        • Taiwan
      • US Indices
        • S&P500
        • Nasdaq
        • Dow Jones
        • Dow Jones Utilities
    • Stocks
      • Asian Stocks
        • Indian Stocks Trading
        • Dubai Stocks Outlook
        • Japanese Stocks
        • Kuwait stocks
        • Saudi Stocks Outlook
      • African Stocks
        • Egyptian Stocks
      • Swiss Stocks
      • Australian Stocks
      • European Stocks
      • US Stocks outlook
      • UK Stocks
  • Commodities
    • Copper
    • Gasoline
    • Gold
    • Natural Gas
    • Oil
    • Palm Oil
    • Raw Sugar
    • Rubber
    • Soybean Oil
    • Silver
  • Forex
    • AUD
    • Bitcoin
    • CAD
    • CHF
    • Euro
    • GBP
    • INR
    • NZD
    • JPY
  • Raves
  • Consulting
    • Consulting
  • Ramki’s Watchlist
WaveTimes Blog WaveTimes Blog
Home » Elliott Wave Analysis of Deutsche Bank
European Stocks

Elliott Wave Analysis of Deutsche Bank

RamkiBy RamkiDecember 13, 20112 Comments2 Mins Read
Facebook Twitter LinkedIn Telegram Pinterest Tumblr Reddit WhatsApp Email
Share
Facebook Twitter LinkedIn Pinterest Email

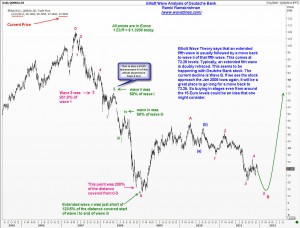
Elliott Wave analysis of Deutsche Bank’s stock price chart suggests that the decline into January 2009 finished with an extended fifth wave. Of all the patterns that one can use to anticipate future moves, an extended fifth wave is probably the most reliable. (See for example, Fifth wave extensions can make you rich)

The attached chart shows you how the internal waves of Deutsche Bank’s stock price movements are all related to each other, and it is fascinating, to say the least. We have already seen a relatively quick recovery to around EUR 55.25, which is, in my opinion, just the first leg of the move required to correct the whole sell off. Elliott Wave theory suggests that extended fifth waves experience what is known as a double retracement. What this means is the trader (or investor) should be prepared for a retest of the fifth wave bottom (occasionally even an overthrow!) But once the second test of the low is achieved, we will see an even quicker recovery than the first rally. The earliest target for the recovery is put at the wave 2 level of the extended fifth wave. This comes at EUR72 (or USD95 using today’s exchange rate).

For those who wish to see a fundamental view on Deutsche Bank, I suggest stopping by at Tefris.com

Deutsche Bank AG Fifth wave extensions
Share. Facebook Twitter Pinterest LinkedIn Tumblr Telegram Email
Previous ArticleElliott Wave update on Crude Oil 12 Dec 2011
Next Article IBM: Elliott Wave Analysis
Ramki
  • Website

Related Posts

Fifth wave opportunity: USD/YEN case study

July 27, 2009

Deutsche Rejects a Rescue, Even as Its Shares Tumble

December 2, 2008

Rambus Inc rallies, and has way to go!

December 2, 2008
View 2 Comments

2 Comments

  1. Alexander on January 25, 2012 3:44 am

    Hello Ramki

    I read your forecast for Deutshe Bank’s stock. Since then I’ve been watching this stock. A few days ago the price has risen above the wave 4. Is it possible that the price will move up to the area 59-71 from the current level.

    And, if possible, your view on the currency pair EURUSD. The movement from 1.26 to 1.3061 is the first impulse up or correction?

    Reply
    • Ramki on January 25, 2012 3:47 am

      Hi Alexander, There is a growing chance that we are already on our way higher. However, there is initial resistance at around EUR35. See what happens there. It should not come back below 30.85 now for the bullish view to remain in force. (Overlap of minor wave 1). About the EUro, no change in view from my last post on the currency. Best. Ramki

      Reply

Leave A Reply Cancel Reply

Recent Posts
  • Has Meta (Facebook) stock seen the bottom
  • What Is The Nearest Technical Support For Meta (NASDAQ: FB)
  • Using Elliott Waves to Capture a Trade in S&P500
  • Hedge Funds and Elliott Waves – Netflix $NFLX
  • When Elliott Waves applauds the promoter’s signals!

WaveTimes is a Research Organization dedicated to providing original analysis, reports, reviews, and insights on developments in mutual funds, stocks, investing, foreign exchange, commodities, and bonds.

Contact WaveTimes

L-601 Mantri Espana,

Kariyammana Agrahara, Bellandur, Bangalore 560103

Follow Us

  • Facebook
  • YouTube
  • Twitter

© 2023 Wave Times. All Rights Reserved.
  • About
  • Books
  • Privacy Policy
  • Policies and Standards

Type above and press Enter to search. Press Esc to cancel.