• About
  • Elliott Waves
    • Elliott Waves Explained
    • Elliott Wave Magic Illustrated with Wave Charts
    • Elliott Wave Edge – How Elliott Wave Traders Win
    • Fibonacci Number Series and Elliott Waves
    • How to use Fibonacci Ratio Retracements
    • Elliott Wave Books
      • The Elliott Wave Book – Five Waves to Financial Freedom
      • Dividend Growth Investing Using Elliott Waves
    • Videos
  • Equities
    • Indices
      • Africa
        • Egypt
      • Australia
      • European Indices
        • AEX – Index, Amsterdam
        • DAX Index
        • Istanbul
        • Russia
        • Spain’s IBEX 35
      • Asian Indices
        • India
        • China
        • Dubai
        • Kuwait
        • Kuala Lumpur
        • Pakistan
        • Saudi
        • Taiwan
      • US Indices
        • S&P500
        • Nasdaq
        • Dow Jones
        • Dow Jones Utilities
    • Stocks
      • Asian Stocks
        • Indian Stocks Trading
        • Dubai Stocks Outlook
        • Japanese Stocks
        • Kuwait stocks
        • Saudi Stocks Outlook
      • African Stocks
        • Egyptian Stocks
      • Swiss Stocks
      • Australian Stocks
      • European Stocks
      • US Stocks outlook
      • UK Stocks
  • Commodities
    • Copper
    • Gasoline
    • Gold
    • Natural Gas
    • Oil
    • Palm Oil
    • Raw Sugar
    • Rubber
    • Soybean Oil
    • Silver
  • Forex
    • AUD
    • Bitcoin
    • CAD
    • CHF
    • Euro
    • GBP
    • INR
    • NZD
    • JPY
  • Raves
  • Consulting
    • Consulting
  • Ramki’s Watchlist
Top News

Has Meta (Facebook) stock seen the bottom

March 21, 2022

What Is The Nearest Technical Support For Meta (NASDAQ: FB)

February 7, 2022

Using Elliott Waves to Capture a Trade in S&P500

January 27, 2022
Facebook Twitter Instagram
WaveTimes Blog WaveTimes Blog
Wave times
  • About
  • Elliott Waves
    • Elliott Waves Explained
    • Elliott Wave Magic Illustrated with Wave Charts
    • Elliott Wave Edge – How Elliott Wave Traders Win
    • Fibonacci Number Series and Elliott Waves
    • How to use Fibonacci Ratio Retracements
    • Elliott Wave Books
      • The Elliott Wave Book – Five Waves to Financial Freedom
      • Dividend Growth Investing Using Elliott Waves
    • Videos
  • Equities
    • Indices
      • Africa
        • Egypt
      • Australia
      • European Indices
        • AEX – Index, Amsterdam
        • DAX Index
        • Istanbul
        • Russia
        • Spain’s IBEX 35
      • Asian Indices
        • India
        • China
        • Dubai
        • Kuwait
        • Kuala Lumpur
        • Pakistan
        • Saudi
        • Taiwan
      • US Indices
        • S&P500
        • Nasdaq
        • Dow Jones
        • Dow Jones Utilities
    • Stocks
      • Asian Stocks
        • Indian Stocks Trading
        • Dubai Stocks Outlook
        • Japanese Stocks
        • Kuwait stocks
        • Saudi Stocks Outlook
      • African Stocks
        • Egyptian Stocks
      • Swiss Stocks
      • Australian Stocks
      • European Stocks
      • US Stocks outlook
      • UK Stocks
  • Commodities
    • Copper
    • Gasoline
    • Gold
    • Natural Gas
    • Oil
    • Palm Oil
    • Raw Sugar
    • Rubber
    • Soybean Oil
    • Silver
  • Forex
    • AUD
    • Bitcoin
    • CAD
    • CHF
    • Euro
    • GBP
    • INR
    • NZD
    • JPY
  • Raves
  • Consulting
    • Consulting
  • Ramki’s Watchlist
WaveTimes Blog WaveTimes Blog
Home » Elliott Wave Analysis of Crude Oil – 2 Nov 2011
Oil

Elliott Wave Analysis of Crude Oil – 2 Nov 2011

RamkiBy RamkiNovember 2, 201115 Comments1 Min Read
Facebook Twitter LinkedIn Telegram Pinterest Tumblr Reddit WhatsApp Email
Share
Facebook Twitter LinkedIn Pinterest Email

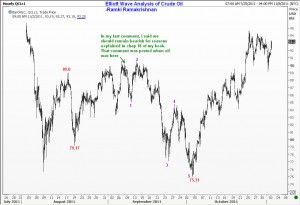
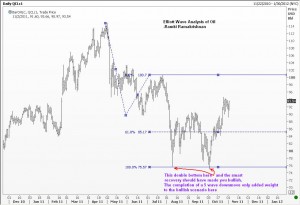
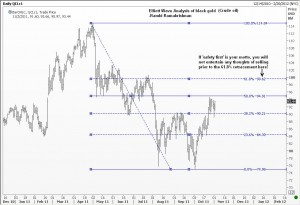
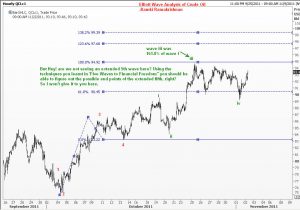
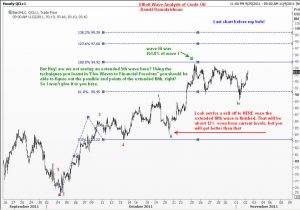
Elliott Wave Analysis works very nicely in commodities. There is a lot of money to be made if you can apply the techniques you learnt in Five Waves to Financial Freedom. Trouble is, even if you learn the methods, you need to have the capital and the stomach to pull the trigger at the right time, and more importantly, to stay with the trade until your sensible stops are done or your profit levels are reached. This is a challenge that ranks at par with being good at analysng the markets.

Now without any further ado, let me present you with your favorite charts! Enjoy!

By the way, I am off on an exotic holiday to Cambodia tomorrow.
Best of luck in the meantime, and if the Forum goes live, you may start sharing your thoughts and ideas with other members right away.

crude crudeoil Oil
Share. Facebook Twitter Pinterest LinkedIn Tumblr Telegram Email
Previous ArticleElliott Wave Update on EURUSD 2 Nov 2011
Next Article Elliott Wave Analysis of Caterpillar Inc
Ramki
  • Website

Related Posts

Crude Oil & Brent Crude Outlook: Can I get more wrong than this?

July 1, 2012

Elliott Wave Outlook for Brent Crude

June 26, 2012

Crude Oil Still Has Another 10% Price Drop In The Well

June 25, 2012
View 15 Comments

15 Comments

  1. Vishal G Ruparel on November 2, 2011 11:10 am

    Ramki enjoy the time off, cant think off a better time to escape from this madness!

    Reply
  2. Dan on November 2, 2011 11:31 am

    Absoluately agree,
    one thing is to know what to do, another thing is to do it.
    Great charts!

    Reply
  3. Ajay on November 2, 2011 11:59 am

    Sir
    Thanks for your analysis
    It is helping me a lo to learn

    Wanted to ask one question:-
    As compared to other waves do not you think 5th is getting way too big and time consuming???
    plz let me know

    Reply
    • Ramki on November 2, 2011 8:03 pm

      Hi Ajay, fifth waves can sometimes take this long.

      Reply
  4. Tarun Dang on November 2, 2011 12:28 pm

    I don’t follow crude oil but I regularly visit your blog. Couldn’t help but notice that the second chart is very reminiscent of the NSEI charts, at least for the last 6 months. And interestingly we completed a double bottom on Nifty as well. So probably, taking cue from the crude oil chart, Nifty could be headed higher too in the short run.

    Reply
  5. Nayan on November 2, 2011 9:49 pm

    Sir,

    Your posts are very helpful! You deserve this break… Enjoy & have a great time off!

    Cheers,

    Reply
  6. harsh dixit on November 3, 2011 8:43 am

    dear sir , there is a small problem here that sub wave iv come in sub wave i. i saw it on netdania .com.pls clear that if some problem in netdania.
    thanx in advance
    your fallower

    Reply
    • Ramki on November 3, 2011 8:46 am

      Harsh, I m at the airport. Best ou post this question in the forum under commodities and others will answer you.nth orum is meant for readers to interact!

      Reply
  7. Joe on November 13, 2011 5:33 am

    Hi Ramki

    One clarification, the 4th chart you label i wave
    within 5th wave one notch up, shdnt the prior high be i and
    the one you labeled as i shd be iii. Was not clear
    Great work !!!

    Reply
    • Ramki on November 13, 2011 11:17 pm

      Hi Joe, if you do that, wave iv will overlap wave i.

      Reply
  8. Giriraj Sharma on November 16, 2011 2:30 pm

    Hi Ramki,

    It seems like the recovery from bottom is a A-B-C recovery, in which A wave completed where you have marked 3 (red) and 4 (red) is a B wave. What we are witnessing now seems to be a longer C wave which is 161.8% of A wave.

    What are your thought?

    Thanks

    Reply
  9. Abhilasha on November 16, 2011 6:25 pm

    Sir,

    Crude @ $102. Request you to please post an update. I also have a question. With INR depreciating with respect to the dollar, in INR, crude has surpassed its previous swing peak of April-May 2011, while in dollar terms, it is still 10% lower. Does that make any difference to wave counts? Request you to post wave counts for crude in both INR and $ so that we can understand better. Thanks.

    Reply
    • Ramki on November 16, 2011 7:45 pm

      Abhilasha, expressing the price of a commodity in different currencies will give you different levels to reckon with because of the movement of those currencies against each other. He world trades crude in Usd. So your best counts will be found in that currency for crude.

      Reply
  10. Soni Hitesh on November 17, 2011 12:27 am

    Respected Sir,
    Crude trade right now @ 102.77 so this wave we consider 5th of 5th wave extension.
    request you to please blog an update.

    Reply
  11. prithvi on November 17, 2011 1:23 am

    Dear Ramki,

    As per calculation of forum by saha, crude now 103.37 US$.
    Now is it end of uptrend?
    Please update about crude.

    Reply

Leave A Reply Cancel Reply

Recent Posts
  • Has Meta (Facebook) stock seen the bottom
  • What Is The Nearest Technical Support For Meta (NASDAQ: FB)
  • Using Elliott Waves to Capture a Trade in S&P500
  • Hedge Funds and Elliott Waves – Netflix $NFLX
  • When Elliott Waves applauds the promoter’s signals!

WaveTimes is a Research Organization dedicated to providing original analysis, reports, reviews, and insights on developments in mutual funds, stocks, investing, foreign exchange, commodities, and bonds.

Contact WaveTimes

L-601 Mantri Espana,

Kariyammana Agrahara, Bellandur, Bangalore 560103

Follow Us

  • Facebook
  • YouTube
  • Twitter

© 2023 Wave Times. All Rights Reserved.
  • About
  • Books
  • Privacy Policy
  • Policies and Standards

Type above and press Enter to search. Press Esc to cancel.