 When dealing with financial markets, you should always be ready to change your mind about the framework on which you are basing your analysis. If everything was laid out cut and dried, there won’t be a market because everyone would know what is going to happen. Take the case of crude oil.
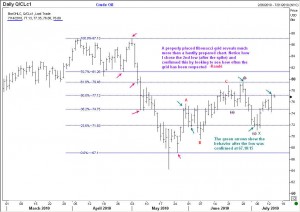
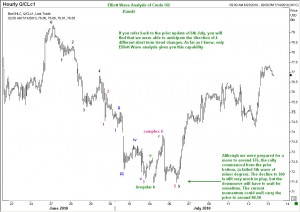
  In my Elliott wave analysis of oil presented to you on 6th July, I used an hourly chart to project as far as possible about the likely moves. I suggest that you print the chart attached to that update and view it alongside the chart of today. You will see that in terms of the waves, I am continuing to be faithful to the original version, because the twists and turns have happened exactly as anticipated. However, when we reached $76, instead of coming down directly to $60, the price went only to around 74.25 and has since traded higher again. You should understand that Hourly charts are useful only to a limited extent. There are too many factors that impact the market. It is wonderful that we got so many good moves using the hourly chart. The bigger picture still calls for a large sized down move in Oil. We will attempt to pin point the top as we approach it. Till that time, you are on your own, because I am currently updating the blog less frequently than previously. Good luck.
Elliott Wave Analysis of Crude Oil 14 July 2010

Unleash your Potential
Transform your trading – Starting Today
