• About
  • Elliott Waves
    • Elliott Waves Explained
    • Elliott Wave Magic Illustrated with Wave Charts
    • Elliott Wave Edge – How Elliott Wave Traders Win
    • Fibonacci Number Series and Elliott Waves
    • How to use Fibonacci Ratio Retracements
    • Elliott Wave Books
      • The Elliott Wave Book – Five Waves to Financial Freedom
      • Dividend Growth Investing Using Elliott Waves
    • Videos
  • Equities
    • Indices
      • Africa
        • Egypt
      • Australia
      • European Indices
        • AEX – Index, Amsterdam
        • DAX Index
        • Istanbul
        • Russia
        • Spain’s IBEX 35
      • Asian Indices
        • India
        • China
        • Dubai
        • Kuwait
        • Kuala Lumpur
        • Pakistan
        • Saudi
        • Taiwan
      • US Indices
        • S&P500
        • Nasdaq
        • Dow Jones
        • Dow Jones Utilities
    • Stocks
      • Asian Stocks
        • Indian Stocks Trading
        • Dubai Stocks Outlook
        • Japanese Stocks
        • Kuwait stocks
        • Saudi Stocks Outlook
      • African Stocks
        • Egyptian Stocks
      • Swiss Stocks
      • Australian Stocks
      • European Stocks
      • US Stocks outlook
      • UK Stocks
  • Commodities
    • Copper
    • Gasoline
    • Gold
    • Natural Gas
    • Oil
    • Palm Oil
    • Raw Sugar
    • Rubber
    • Soybean Oil
    • Silver
  • Forex
    • AUD
    • Bitcoin
    • CAD
    • CHF
    • Euro
    • GBP
    • INR
    • NZD
    • JPY
  • Raves
  • Consulting
    • Consulting
  • Ramki’s Watchlist
Top News

Has Meta (Facebook) stock seen the bottom

March 21, 2022

What Is The Nearest Technical Support For Meta (NASDAQ: FB)

February 7, 2022

Using Elliott Waves to Capture a Trade in S&P500

January 27, 2022
Facebook Twitter Instagram
WaveTimes Blog WaveTimes Blog
Wave times
  • About
  • Elliott Waves
    • Elliott Waves Explained
    • Elliott Wave Magic Illustrated with Wave Charts
    • Elliott Wave Edge – How Elliott Wave Traders Win
    • Fibonacci Number Series and Elliott Waves
    • How to use Fibonacci Ratio Retracements
    • Elliott Wave Books
      • The Elliott Wave Book – Five Waves to Financial Freedom
      • Dividend Growth Investing Using Elliott Waves
    • Videos
  • Equities
    • Indices
      • Africa
        • Egypt
      • Australia
      • European Indices
        • AEX – Index, Amsterdam
        • DAX Index
        • Istanbul
        • Russia
        • Spain’s IBEX 35
      • Asian Indices
        • India
        • China
        • Dubai
        • Kuwait
        • Kuala Lumpur
        • Pakistan
        • Saudi
        • Taiwan
      • US Indices
        • S&P500
        • Nasdaq
        • Dow Jones
        • Dow Jones Utilities
    • Stocks
      • Asian Stocks
        • Indian Stocks Trading
        • Dubai Stocks Outlook
        • Japanese Stocks
        • Kuwait stocks
        • Saudi Stocks Outlook
      • African Stocks
        • Egyptian Stocks
      • Swiss Stocks
      • Australian Stocks
      • European Stocks
      • US Stocks outlook
      • UK Stocks
  • Commodities
    • Copper
    • Gasoline
    • Gold
    • Natural Gas
    • Oil
    • Palm Oil
    • Raw Sugar
    • Rubber
    • Soybean Oil
    • Silver
  • Forex
    • AUD
    • Bitcoin
    • CAD
    • CHF
    • Euro
    • GBP
    • INR
    • NZD
    • JPY
  • Raves
  • Consulting
    • Consulting
  • Ramki’s Watchlist
WaveTimes Blog WaveTimes Blog
Home » Elliott Wave Analysis of CPER -ETF- United States Copper Index Fund
Copper

Elliott Wave Analysis of CPER -ETF- United States Copper Index Fund

RamkiBy RamkiMarch 1, 201920 Comments4 Mins Read
Facebook Twitter LinkedIn Telegram Pinterest Tumblr Reddit WhatsApp Email
Share
Facebook Twitter LinkedIn Pinterest Email

Elliott Wave analysis is a great tool to help you decide an appropriate levels to gain exposure to any asset class. CPER – ETF – or the United States Copper Index Fund has recently been in the news. Yahoo Finance has run this article that says ‘industrial metals-related exchange traded products are strengthening this year as tightening inventory levels and rising optimism for a return to global growth following a U.S.-China trade deal are supporting the fundamental outlook.” Specifically, CPER has gained 12% this year-to-date! So let us see how we can use Elliott Wave analysis to gain an edge if you are considering an exposure to this ETF.

The first step to trading smart.

When you look at any chart, you should look for clues. When you see the chart of CPER below, what do you make out?

Your first step
5 waves up in CPER
5 waves up in CPER

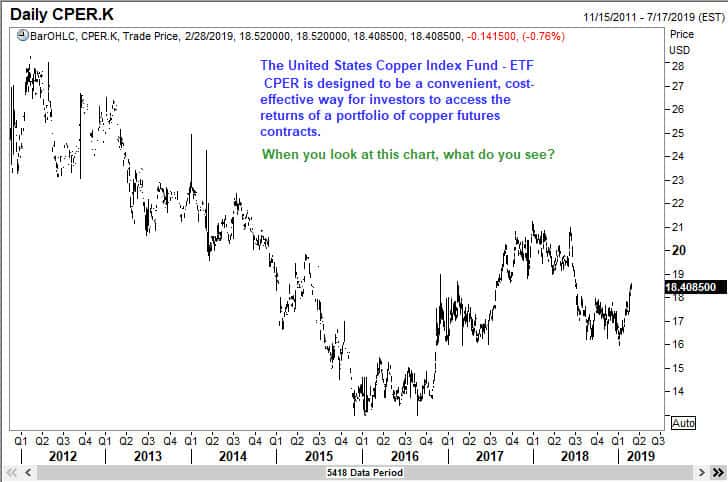
At a very basic, novice level, you would not be buying as the wave 5 is approaching its target. Rather, if you had been long at any lower level, you will start to downsize those positions as wave 5 is progressing higher.

Labeling the waves

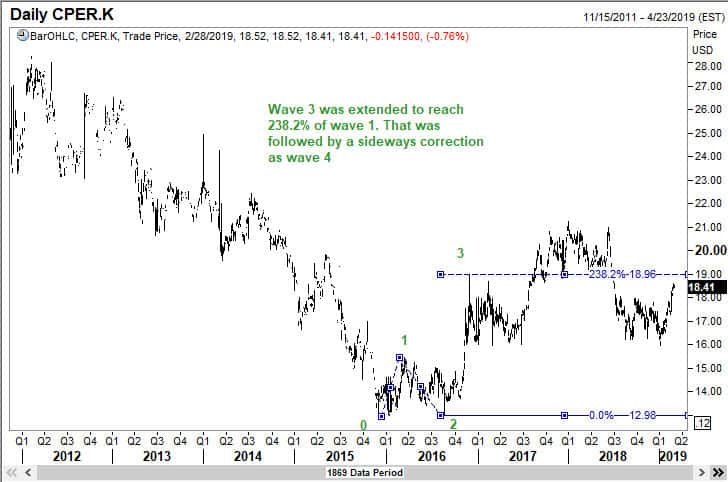
Once you have tentatively decided were to place the labels, you use Fibinacci tools to see if they confirm your assessment. In the above chart, we see that wave 3 finished at the 223.6% projection of wave 1.

Wave 4 in CPER

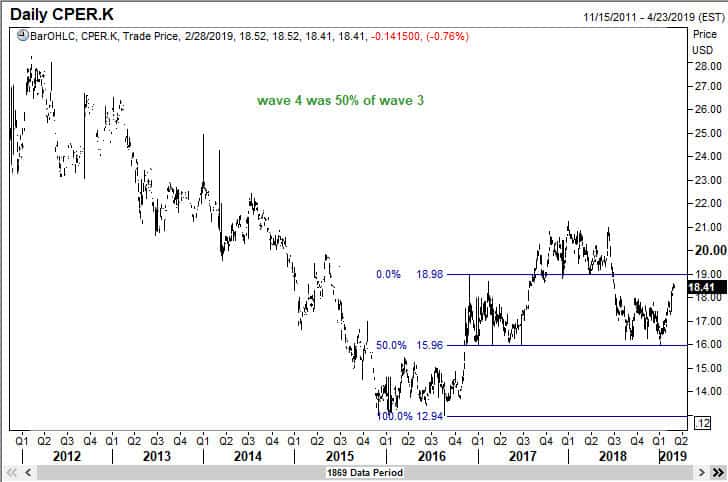
Once the sharp third wave up in CPER ran out of steam, we saw the commencement of a sideways correction, which we know as wave 4. The Fibonacci tool should have helped us anticipate where wave 4 could end, and sure enough, we saw that happen at the 50% retracement of wave 3.

Wave 5 is related to wave 1

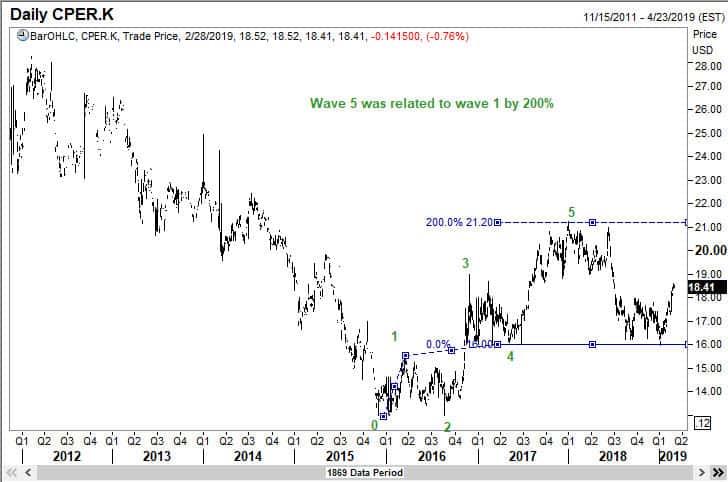
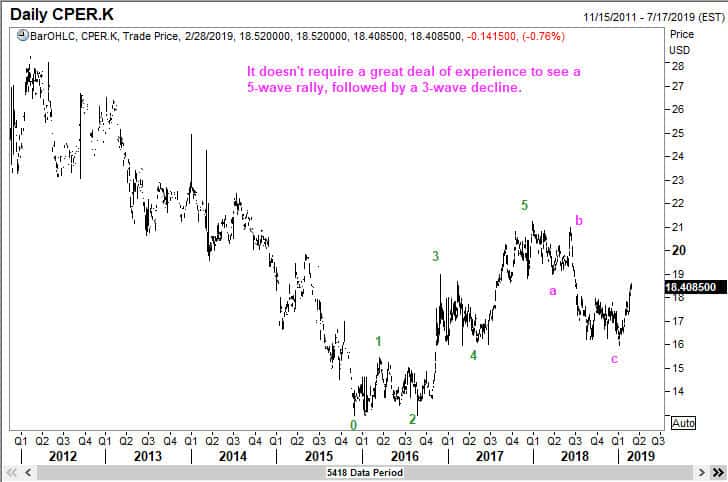
My book on Elliott Waves , Five Waves to Financial Freedom, explains how we can anticipate the possible end of wave 5. In this case, we see that wave 5 was related to wave 1 by a Fibonacci number. We also know that once a 5-wave move ends, there will be a correction of the entire bull cycle. Therein lies a great advantage to the user of Elliott Wave analysis. He or she will start getting out of any long positions as we approach the end of wave 5, or as soon as it becomes clear we have completed the bull cycle.

A 3-wave correction in CPER

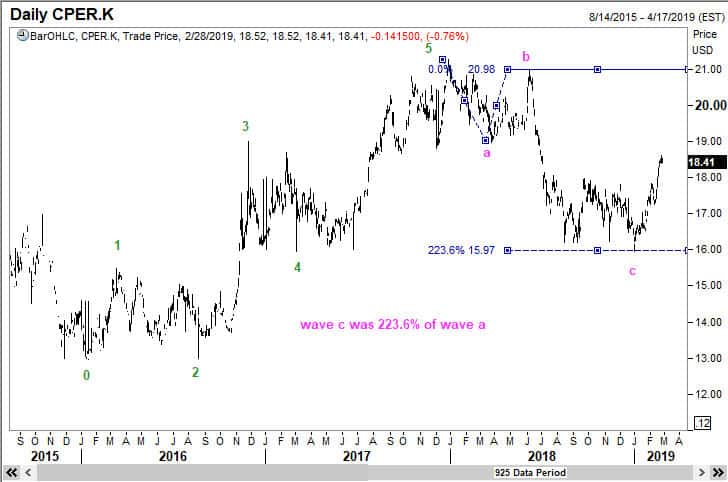
We see here that the three wave correction that came after the end of the 5-wave bull cycle also can be analyzed using the Fibonacci relationship between the waves. Wave c was 223.6% of wave 1. But the more important clue is seen in the next chart.

The correction reached the 61.8% retracement level

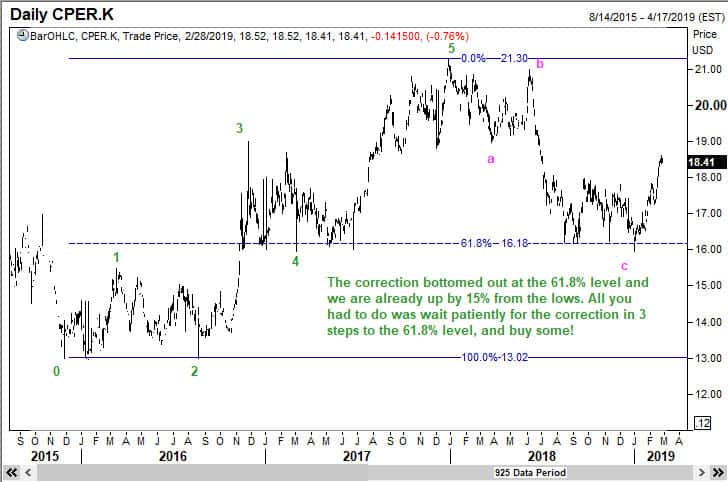
One of the most important ratios that we use in Elliott Wave analysis is the 61.8% retracement level. As a matter of fact, a patient trader needs to do nothing more than wait for such a move to happen and buy there. No other complex analysis is needed to make money. Just a simple watch over several stocks or commodities and entering near the 61,8% retracement is a model that will yield handsome profits! In this case, where the Wave C corresponded with the 61.8% retracement is a much more powerful signal. Sure enough, CPER has rallied sharply from there.

What next?

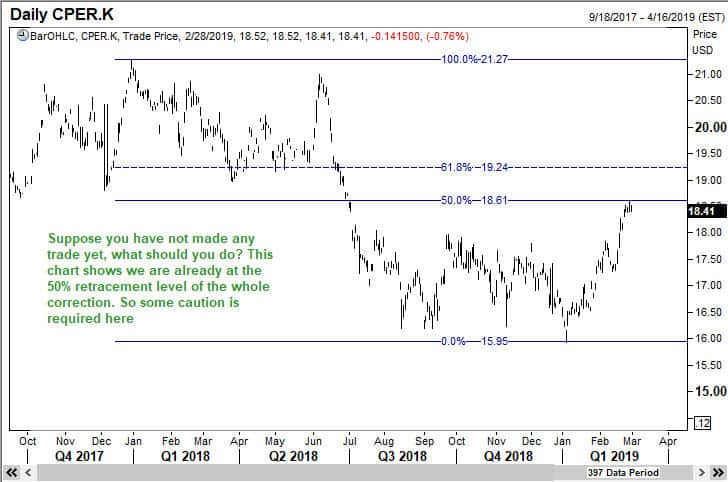
Knowing where to enter is of great importance to a trader. Clearly, buying CPER right here is not recommended by Elliott Waves because that won’t be a low-risk trade. My approach is to be smart about this business. Take those trades where the odds favor you. Near the 50% retracement level is not such a level.

Deciding on where we are now

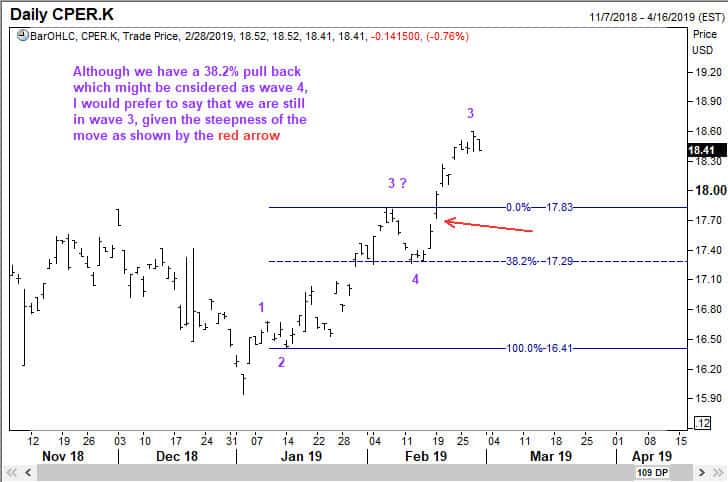
We now have to make an assessment of where we are in the progression. As you can see from the comments in the chart above, we are probably in the late stages of wave 3. So the right approach will be to wait for wave 4 and then buy that dip.

Some tricks of the trade

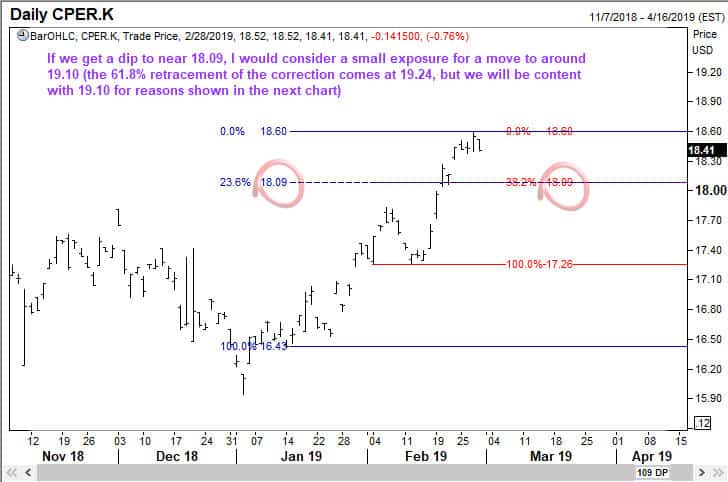
You will see that a deft use of the Fibonacci tool gives you an added level of comfort. So the earliest level to try a long trade will be near the 18.10 level.

Where is the upside target in CPER?

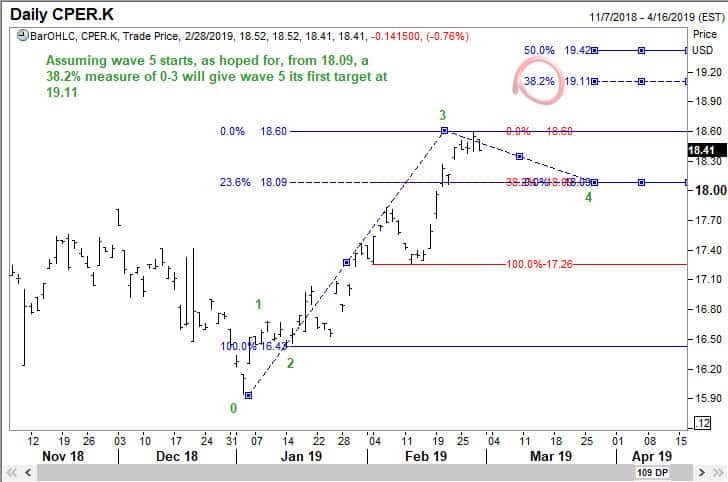
You can also make an assessment of how high CPER can go. This will allow you to decide the risk-reward trade off and the position size. You can see that Elliott Wave analysis of CPER suggests an optimistic target of 19.10, which is more than 5% up from our panned entry level.

At WaveTimes, you see numerous examples of how we can use Elliott Waves to take low-risk bets in the market. Good luck in your pursuit of Financial Freedom.

copper CPER ETF
Share. Facebook Twitter Pinterest LinkedIn Tumblr Telegram Email
Previous ArticleHow to effectively use the power of Elliott Waves in your trading?
Next Article The Elliott Wave Course – How to Profit from Elliott Waves
Ramki
  • Website

Related Posts

Special Update to my Elliott Wave Book

April 5, 2018

How Elliott Wave Analysis anticipated higher Copper prices

July 25, 2017

Using Elliott Waves to invest in Mid Caps

June 11, 2014
View 20 Comments

20 Comments

  1. Timothy Joseph on March 1, 2019 12:30 pm

    Excellent article, Ramki. Enjoyed by this reader.

    Reply
  2. Payal on April 12, 2019 3:22 pm

    Hello sir ..
    Sir after reading your book
    I got immense confidence
    But I have one question in my mind
    That within correction A b c
    A and c waves can be extended or not ?

    Reply
    • Ramki Ramakrishnan on April 16, 2019 5:16 am

      Payal, Generally speaking extensions are seen in impulse waves. However, within a correction such as a zig zag, waves A and Waves C have 5 sub waves, and they are considered impulses within their own rights. Hence, we do see extensions there, especially in the C waves, which is why you often see devastating sell offs

      Reply
  3. Zubairsharif on April 17, 2019 2:55 pm

    Helo sir ramki..very nice calculation of market u r doing.sir im a beginner just for the sake of learning my ques is if its not extended wave 3 and its 5 then we are going to the 2nd wave of 5 how we will hit our target?

    Reply
    • Ramki Ramakrishnan on April 18, 2019 11:37 am

      Zubair, The more important question is whether you are trying to publish a research report where you make forecasts, or whether you are going to trade. Once you decide to trade, you will know where to enter, and where to exit on either scenario.

      Reply
  4. Julius on May 17, 2019 3:38 pm

    Hi Ramki. I enjoy your blogs. I regularly keep checking new blogs from your site with a longing I cannot explain. Its been 2 years now since I laid my hands on your best selling book- five waves to financial freedom. It’t was worth it. Recently I purchased your second book on investing..Great insights always. Wish you the best of the earth man!

    Reply
    • Ramki Ramakrishnan on June 7, 2019 8:58 am

      Julius, Thank you for taking time to write.

      Reply
  5. Mihir on July 19, 2019 7:21 pm

    You have changed labelled 3 wave considering steep rise from 23.6%. Is there any thumb.rule .? What if I would trade considering wave 3 on the old place assuming the rise of 5 th wave ? Would I make sense then ?

    Reply
  6. Keshvi Jha on July 23, 2019 11:08 am

    Thank you for sharing this. You have strong content. Keep sharing.

    Reply
  7. Johannes on August 4, 2019 1:31 am

    Dear Sir Ramki,

    Hi Ramki, I am Johann, and i am a reader of your book, five ways to fundamental freedom.
    I am new to Elliot Wave. Actually your book is the first lesson i learn about Elliot Wave, because many people recommended it. And after tried a sample i decided that your book is one of the simplest explain Elliot wave principle yet still capture the most importance essence of EWP.
    There is one terminology that i’m not fully understand.
    What is reflex point? There is no further definition about it.
    And i have try to google it with no satisfying answer.
    One more thing, does the Elliot wave principle can be applied anytime, at all the time at the market? Or it just apply on certain condition. By another word i mean at any given moment in the market we can just look at the chart and start numbering wave, and we can decide on what wave we are currently.

    Thx a lot.

    Reply
  8. Jean on August 20, 2019 1:04 pm

    Hi Ramki, thank you for writing this article! It would be nice to have an update on copper as price retraced almost all the last impulse you were describing and I took a long position. Congratulations for your book that really enlightned me on the wave principle and its daily use. I combined Elliot wave analysis with harmonics on lower timeframes to improve my entries and exit. What I really like about wave principles are the set of rules that give clear invalidation level (stop loss), capital preservation first!
    Note: could you have a look at GOLD/AUD (XAU/AUD), the weekly chart looks a like to have pretty long fifth extension!

    Reply
    • Ramki Ramakrishnan on August 22, 2019 11:40 am

      Jean, Thanks for your message, I have been busy completing the recording of my online course, which has just gone live. Will start updating the blog more often now.

      Reply
  9. Omar Ahmed on October 15, 2019 12:04 pm

    Great Analysis Mr. Ramki.

    I have a question that seems to puzzle me but thought an expert of your caliber was the right person to ask. WXY is each made up of a corrective wave pattern. Zigzag – Flat – Zigzag is an example. The wave (A) of a Flat is made up of a 3 wave structure which could also be either a zigzag or a Flat. Thus, how can we tell to label a wave structure either wave (A) of a Flat or wave (W) which then leads to WXY? Thank you, Mr. Ramki.

    Reply
    • Ramki Ramakrishnan on October 16, 2019 3:38 pm

      Omar,
      I am not sure if I understood the question. So I will provide two responses. If you are wondering how we can anticipate a possible development of the ‘X’ and then the ‘Y’ components of a potential WXY pattern, the answer is you can’t. It is well neigh impossible to anticipate what pattern a complex correction would take. On the other hand, if your question is how can we label a wave as wave A, which will eventually be called wave W of a WXY pattern, the answer is more like this: the notations are merely tools to help us understand where we are in the scheme of things. Elliott has said we can label the impulse phase that consists of 5 waves as waves 1 to 5. The corrective waves are generally assigned numerals. A little reflection would make us understand that these notations are nothing more than a consistent way of referencing where we are in the cycle. Having said that, once again we have to remind ourselves that there is no way to know whether a complex correction will actually trace out as WXY or something else. What matters is we usually know in advance if a complex correction is likely to show up, and that itself is a huge advantage over someone who keeps trading the market without knowing of the increased likelihood of such a correction.

      Reply
      • Omar Ahmed on October 21, 2019 10:43 pm

        Mr. Ramki,

        Thank you for answering both my questions. They had been plaguing my mind for months. You took a complex topic and simplified it beautifully. This is a prime example of why many people regard you as the best EW trader in the world. Thank you once again.

        Reply
  10. BHARAT MANGUKIYA on October 3, 2020 5:06 am

    Sir In FWFFD Book about Zig-Zag correction mentioned as : B wave usually ends well above the start of the wave A .
    It mean wave B retrace 38.2 or 61.8? which one is suitable Fibonacci ratio for wave B in ABC Zig-zag correction?

    Reply
    • Ramki Ramakrishnan on October 3, 2020 10:48 am

      Bharat, The book is FWTFF. Secondly, I recommend that you read the book again because what you have stated about B wave ending well above the starting point of wave A is completely wrong, and is not there in the book! Maybe you should join the online program to better understand these concepts.

      Reply
  11. BHARAT MANGUKIYA on October 4, 2020 6:10 am

    Yes sir FWTFF . It is mention in simple zig-zag correction and just below the Fig 11a Zig-zag correction caterpillar inc chart
    wording as , The key points to note about zig-zag correction is Wave B usually ends well above the start of A, and wave c travels well above the top of A.

    Sir my confusion is wave B correct deep or shallow correction in Zig-zag?

    Reply
    • Ramki Ramakrishnan on October 9, 2020 5:28 am

      Bharat, The information whether wave B of a zigzag is shallow or deep is not of much use from the point of view of the Principle of alternation. Inside an impulse wave that comprises 5 waves, we have 2 corrections, namely wave 2 and wave 4. There, if wave 2 is deep, we could expect a shallow wave 4. But wave B is having just 3 waves! Maybe you should read the book carefully again and things will become clearer

      Reply
  12. BHARAT MANGUKIYA on October 10, 2020 2:37 pm

    Thank you sir . i understand the thing.

    Reply

Leave A Reply Cancel Reply

Recent Posts
  • Has Meta (Facebook) stock seen the bottom
  • What Is The Nearest Technical Support For Meta (NASDAQ: FB)
  • Using Elliott Waves to Capture a Trade in S&P500
  • Hedge Funds and Elliott Waves – Netflix $NFLX
  • When Elliott Waves applauds the promoter’s signals!

WaveTimes is a Research Organization dedicated to providing original analysis, reports, reviews, and insights on developments in mutual funds, stocks, investing, foreign exchange, commodities, and bonds.

Contact WaveTimes

L-601 Mantri Espana,

Kariyammana Agrahara, Bellandur, Bangalore 560103

Follow Us

  • Facebook
  • YouTube
  • Twitter

© 2022 Wave Times. All Rights Reserved.
  • About
  • Books
  • Privacy Policy
  • Policies and Standards

Type above and press Enter to search. Press Esc to cancel.