• About
  • Elliott Waves
    • Elliott Waves Explained
    • Elliott Wave Magic Illustrated with Wave Charts
    • Elliott Wave Edge – How Elliott Wave Traders Win
    • Fibonacci Number Series and Elliott Waves
    • How to use Fibonacci Ratio Retracements
    • Elliott Wave Books
      • The Elliott Wave Book – Five Waves to Financial Freedom
      • Dividend Growth Investing Using Elliott Waves
    • Videos
  • Equities
    • Indices
      • Africa
        • Egypt
      • Australia
      • European Indices
        • AEX – Index, Amsterdam
        • DAX Index
        • Istanbul
        • Russia
        • Spain’s IBEX 35
      • Asian Indices
        • India
        • China
        • Dubai
        • Kuwait
        • Kuala Lumpur
        • Pakistan
        • Saudi
        • Taiwan
      • US Indices
        • S&P500
        • Nasdaq
        • Dow Jones
        • Dow Jones Utilities
    • Stocks
      • Asian Stocks
        • Indian Stocks Trading
        • Dubai Stocks Outlook
        • Japanese Stocks
        • Kuwait stocks
        • Saudi Stocks Outlook
      • African Stocks
        • Egyptian Stocks
      • Swiss Stocks
      • Australian Stocks
      • European Stocks
      • US Stocks outlook
      • UK Stocks
  • Commodities
    • Copper
    • Gasoline
    • Gold
    • Natural Gas
    • Oil
    • Palm Oil
    • Raw Sugar
    • Rubber
    • Soybean Oil
    • Silver
  • Forex
    • AUD
    • Bitcoin
    • CAD
    • CHF
    • Euro
    • GBP
    • INR
    • NZD
    • JPY
  • Raves
  • Consulting
    • Consulting
  • Ramki’s Watchlist
Top News

Has Meta (Facebook) stock seen the bottom

March 21, 2022

What Is The Nearest Technical Support For Meta (NASDAQ: FB)

February 7, 2022

Using Elliott Waves to Capture a Trade in S&P500

January 27, 2022
Facebook Twitter Instagram
WaveTimes Blog WaveTimes Blog
Wave times
  • About
  • Elliott Waves
    • Elliott Waves Explained
    • Elliott Wave Magic Illustrated with Wave Charts
    • Elliott Wave Edge – How Elliott Wave Traders Win
    • Fibonacci Number Series and Elliott Waves
    • How to use Fibonacci Ratio Retracements
    • Elliott Wave Books
      • The Elliott Wave Book – Five Waves to Financial Freedom
      • Dividend Growth Investing Using Elliott Waves
    • Videos
  • Equities
    • Indices
      • Africa
        • Egypt
      • Australia
      • European Indices
        • AEX – Index, Amsterdam
        • DAX Index
        • Istanbul
        • Russia
        • Spain’s IBEX 35
      • Asian Indices
        • India
        • China
        • Dubai
        • Kuwait
        • Kuala Lumpur
        • Pakistan
        • Saudi
        • Taiwan
      • US Indices
        • S&P500
        • Nasdaq
        • Dow Jones
        • Dow Jones Utilities
    • Stocks
      • Asian Stocks
        • Indian Stocks Trading
        • Dubai Stocks Outlook
        • Japanese Stocks
        • Kuwait stocks
        • Saudi Stocks Outlook
      • African Stocks
        • Egyptian Stocks
      • Swiss Stocks
      • Australian Stocks
      • European Stocks
      • US Stocks outlook
      • UK Stocks
  • Commodities
    • Copper
    • Gasoline
    • Gold
    • Natural Gas
    • Oil
    • Palm Oil
    • Raw Sugar
    • Rubber
    • Soybean Oil
    • Silver
  • Forex
    • AUD
    • Bitcoin
    • CAD
    • CHF
    • Euro
    • GBP
    • INR
    • NZD
    • JPY
  • Raves
  • Consulting
    • Consulting
  • Ramki’s Watchlist
WaveTimes Blog WaveTimes Blog
Home » Elliott Wave analysis of Copper
Copper

Elliott Wave analysis of Copper

RamkiBy RamkiSeptember 26, 201111 Comments2 Mins Read
Facebook Twitter LinkedIn Telegram Pinterest Tumblr Reddit WhatsApp Email
Share
Facebook Twitter LinkedIn Pinterest Email

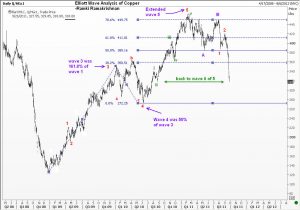
Elliott Wave Analysis of Copper“The finest workers in stone are not copper or steel tools, but the gentle touches of air and water working at their leisure with a liberal allowance of time.” – Henry David Thoreau

I can amend the above quote a little and say “The finest workers in Elliott Wave analysis of Copper is not Goldman Sachs or any other name you choose, but the completion of an extended fifth wave, working with a liberal allowance of time” -Ramki Ramakrishnan

After you have read the link in the quote above, let us take a look at what I wrote back in December 2010. It was a bit ahead of time, because the end came only in February, and reached 462 (some $14 more than the preferred top). But what matters is IT WORKED! Today, we reached the 2nd wave of the extended fifth (at $318) a move of over 30% even from the 448 level. Give it enough time, and we could see Copper reach the prior fourth wave level of one lower degree, and that comes at 272 levels.

PS. SOme of you with sharp eyes would have noticed that I have changed the level where wave 2 was placed back in December 2010. But that does not affect the computation of the target for the extended fifth wave. Of course, you already know that because you have read my book “Five Waves to Financial Freedom” where detailed explanations are given!

copper Ramki
Share. Facebook Twitter Pinterest LinkedIn Tumblr Telegram Email
Previous ArticleElliott Wave Analysis of Gold after sharp downmove
Next Article Elliott Wave analysis of Natural Gas NYMEX
Ramki
  • Website

Related Posts

Elliott Wave Analysis of CPER -ETF- United States Copper Index Fund

March 1, 2019

Special Update to my Elliott Wave Book

April 5, 2018

How Elliott Wave Analysis anticipated higher Copper prices

July 25, 2017
View 11 Comments

11 Comments

  1. Rohit on September 27, 2011 11:55 pm

    Time analysis remains the greyest area of work for technical analysts. Elliott wave forecasts capture price and time is left to the mind..Users always want a free lunch but they will have to learn to handle time if they want to get the best of price. Any other solutions than sheer patience and discipline?

    Reply
    • Ramki on September 28, 2011 5:11 am

      Elliott did attempt to offer some tentative solutions, but in his later works he sidelined this aspect because time is truly difficult to pin point. However, there are some guidelines concerning corrections that touch upon time, which I believe I have explained in the book, towards the end of the chapter dealing with simple corrections – zigzags

      Reply
  2. prithvi on September 30, 2011 4:45 am

    Dear Sir,

    IS THIS GOOD TIME TO SELL COPPER?
    PLEASE REPLY……

    Reply
    • Ramki on September 30, 2011 6:59 am

      Hello Prithvi, Tks for your question. I’m afraid that I am not giving individual trading advice at this time. Good luck!

      Reply
  3. Anonymous on October 31, 2011 11:38 am

    Dear Ramki,
    Its only now since a few months, I guess, MCX real time data is now available on the MT4 platform. I use a particular software for trading crude and silver.
    I use daily pivot levels and compare with international brokers such as GCI, Alpari and Forexyard.
    I would like to install the Auto Elliot wave software on the platform, which can identify the first wave and plot the coming ones. Could you recommend a plug in for MT4 terminal please. I shall be thankful to you.
    Regards,

    Reply
    • Ramki on November 1, 2011 12:14 am

      Hi Anonymous, I dont use any special software and hence don’t know of any good plugins. However, I suggest you post this question in the Forum that should be up in the next day or two.

      Reply
  4. BJ on February 11, 2012 9:00 pm

    Hi Ramki,

    It’s been a good 4 months since your update on copper. It looks the red metal is doing a double zig-zag. With a wide ranged negative candle on friday, an overlap at 367cents looks likely and this may eventually lead to the revisit of previous 4th at 280 later. What are your thoughts?

    Best regards,
    BJ

    Reply
  5. riddhi sheth on April 2, 2012 8:21 am

    hello sir,

    please update your view on copper as its almost six months.

    Thanks,

    Riddhi

    Reply
  6. Karan Chetan on April 13, 2012 11:28 am

    Hi Ramki,

    I tried to continue doing elliott wave analysis for copper from where you left off back in September 2011. It seems to me that we are completing or have completed a complex wave 4. But, wave 4 has overlapped wave 1. Elliott wave analysis mentions that wave 4 cannot overlap wave 1 except within a diagonal triangle. From what I understand, this isn’t a diagonal triangle.
    Your comments are greatly appreciated.

    Karan

    Reply
    • Ramki on April 15, 2012 11:53 pm

      HI Karan, You need to revisit the old chart. Where is Wave 3 if you are speaking of a wave 4 now? Yes, we have recently overlapped the 371 high which means the move from 300 to 398 is only corrective.

      Reply
  7. money gram on April 13, 2013 12:17 am

    Write more, thats all I have to say. Literally, it seems as
    though you relied on the video to make your point. You definitely know what youre talking about, why throw away your
    intelligence on just posting videos to your site when you could be giving
    us something enlightening to read?

    Feel free to surf to my web-site :: Money Gram

    Reply

Leave A Reply Cancel Reply

Recent Posts
  • Has Meta (Facebook) stock seen the bottom
  • What Is The Nearest Technical Support For Meta (NASDAQ: FB)
  • Using Elliott Waves to Capture a Trade in S&P500
  • Hedge Funds and Elliott Waves – Netflix $NFLX
  • When Elliott Waves applauds the promoter’s signals!

WaveTimes is a Research Organization dedicated to providing original analysis, reports, reviews, and insights on developments in mutual funds, stocks, investing, foreign exchange, commodities, and bonds.

Contact WaveTimes

L-601 Mantri Espana,

Kariyammana Agrahara, Bellandur, Bangalore 560103

Follow Us

  • Facebook
  • YouTube
  • Twitter

© 2023 Wave Times. All Rights Reserved.
  • About
  • Books
  • Privacy Policy
  • Policies and Standards

Type above and press Enter to search. Press Esc to cancel.