• About
  • Elliott Waves
    • Elliott Waves Explained
    • Elliott Wave Magic Illustrated with Wave Charts
    • Elliott Wave Edge – How Elliott Wave Traders Win
    • Fibonacci Number Series and Elliott Waves
    • How to use Fibonacci Ratio Retracements
    • Elliott Wave Books
      • The Elliott Wave Book – Five Waves to Financial Freedom
      • Dividend Growth Investing Using Elliott Waves
    • Videos
  • Equities
    • Indices
      • Africa
        • Egypt
      • Australia
      • European Indices
        • AEX – Index, Amsterdam
        • DAX Index
        • Istanbul
        • Russia
        • Spain’s IBEX 35
      • Asian Indices
        • India
        • China
        • Dubai
        • Kuwait
        • Kuala Lumpur
        • Pakistan
        • Saudi
        • Taiwan
      • US Indices
        • S&P500
        • Nasdaq
        • Dow Jones
        • Dow Jones Utilities
    • Stocks
      • Asian Stocks
        • Indian Stocks Trading
        • Dubai Stocks Outlook
        • Japanese Stocks
        • Kuwait stocks
        • Saudi Stocks Outlook
      • African Stocks
        • Egyptian Stocks
      • Swiss Stocks
      • Australian Stocks
      • European Stocks
      • US Stocks outlook
      • UK Stocks
  • Commodities
    • Copper
    • Gasoline
    • Gold
    • Natural Gas
    • Oil
    • Palm Oil
    • Raw Sugar
    • Rubber
    • Soybean Oil
    • Silver
  • Forex
    • AUD
    • Bitcoin
    • CAD
    • CHF
    • Euro
    • GBP
    • INR
    • NZD
    • JPY
  • Raves
  • Consulting
    • Consulting
  • Ramki’s Watchlist
Top News

Has Meta (Facebook) stock seen the bottom

March 21, 2022

What Is The Nearest Technical Support For Meta (NASDAQ: FB)

February 7, 2022

Using Elliott Waves to Capture a Trade in S&P500

January 27, 2022
Facebook Twitter Instagram
WaveTimes Blog WaveTimes Blog
Wave times
  • About
  • Elliott Waves
    • Elliott Waves Explained
    • Elliott Wave Magic Illustrated with Wave Charts
    • Elliott Wave Edge – How Elliott Wave Traders Win
    • Fibonacci Number Series and Elliott Waves
    • How to use Fibonacci Ratio Retracements
    • Elliott Wave Books
      • The Elliott Wave Book – Five Waves to Financial Freedom
      • Dividend Growth Investing Using Elliott Waves
    • Videos
  • Equities
    • Indices
      • Africa
        • Egypt
      • Australia
      • European Indices
        • AEX – Index, Amsterdam
        • DAX Index
        • Istanbul
        • Russia
        • Spain’s IBEX 35
      • Asian Indices
        • India
        • China
        • Dubai
        • Kuwait
        • Kuala Lumpur
        • Pakistan
        • Saudi
        • Taiwan
      • US Indices
        • S&P500
        • Nasdaq
        • Dow Jones
        • Dow Jones Utilities
    • Stocks
      • Asian Stocks
        • Indian Stocks Trading
        • Dubai Stocks Outlook
        • Japanese Stocks
        • Kuwait stocks
        • Saudi Stocks Outlook
      • African Stocks
        • Egyptian Stocks
      • Swiss Stocks
      • Australian Stocks
      • European Stocks
      • US Stocks outlook
      • UK Stocks
  • Commodities
    • Copper
    • Gasoline
    • Gold
    • Natural Gas
    • Oil
    • Palm Oil
    • Raw Sugar
    • Rubber
    • Soybean Oil
    • Silver
  • Forex
    • AUD
    • Bitcoin
    • CAD
    • CHF
    • Euro
    • GBP
    • INR
    • NZD
    • JPY
  • Raves
  • Consulting
    • Consulting
  • Ramki’s Watchlist
WaveTimes Blog WaveTimes Blog
Home » Elliott Wave Analysis of Citigroup
US Stocks outlook

Elliott Wave Analysis of Citigroup

RamkiBy RamkiMarch 9, 2012Updated:January 22, 20225 Comments2 Mins Read
Facebook Twitter LinkedIn Telegram Pinterest Tumblr Reddit WhatsApp Email
Share
Facebook Twitter LinkedIn Pinterest Email

This post gives you Elliott Wave analysis of Citigroup [NYSE:C]. It is not easy to deal with corrections, and labelling the waves becomes a challenge. For example, the first ABC higher had a running flat inside it. But you can see that Wave C was equal to Wave A. Observe how I am following all the rules of the Elliott Wave Principle. All B waves, minor b waves and even (b) waves are made up of 3 sub waves. Again, all C waves are made up of 5 waves. You will also notice how I am deciding whether to label a move as a third wave or a C wave. (the implication is profound, because when you label a wave as a C wave, you are expecting the major trend to reassert itself soon).
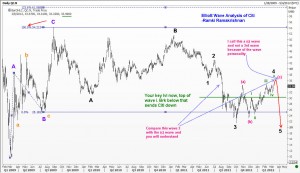
Elliott Wave analysis of Citigroup

As you are aware, the WaveTimes is not offering any advisory service. It is there to share my knowledge of Elliott Waves and once you learn how to deal with the makets, you are able to make your own decisions with confidence. My book Five Waves to Financial Freedom is often known as a living book, because this blog is an extension of that book. After you read that, you will be able to look at the hundreds and hundreds of real life examples here and reinforce your understanding. Best wishes. Ramki

C Citi Citigroup complex correction elliottwaves
Share. Facebook Twitter Pinterest LinkedIn Tumblr Telegram Email
Previous ArticleHewlett Packard has 25% downside
Next Article Now is not the time to buy McDonald's
Ramki
  • Website

Related Posts

Has Meta (Facebook) stock seen the bottom

March 21, 2022

What Is The Nearest Technical Support For Meta (NASDAQ: FB)

February 7, 2022

Hedge Funds and Elliott Waves – Netflix $NFLX

January 17, 2022
View 5 Comments

5 Comments

  1. Raj on March 12, 2012 1:47 pm

    Thanks for sharing your count. For C to go to $18 from $34 (50% correction) almost feels like saying that S&P would go below 1,000. Is that your count on S&P?

    Reply
  2. Jatinderpal S Randhawa on March 13, 2012 7:16 pm

    Please comment on S&P and Dow charts.
    Thanks In Advance.

    Reply
  3. Ramesh on March 23, 2012 2:28 pm

    Ramki : Is it a Double ZigZag pattern ?

    Reply
  4. sc110786 on March 31, 2012 10:16 am

    Hello Ramki,

    Since wave 4 has now crossed over in to wave 1 territory, how does your original outlook change ? Could the 5th wave have already occured and it was truncated ? Please share any thoughts you may have. Thanks.

    Reply
    • Ramki on March 31, 2012 1:38 pm

      Hi SC, Labelling this complex correction has been a challenge fom the beginning. However there is on good thing. Now we can watch the top of wave (a) from the recent lows as the crucial support instead of wave i of the minor five waves up….

      Reply

Leave A Reply Cancel Reply

Recent Posts
  • Has Meta (Facebook) stock seen the bottom
  • What Is The Nearest Technical Support For Meta (NASDAQ: FB)
  • Using Elliott Waves to Capture a Trade in S&P500
  • Hedge Funds and Elliott Waves – Netflix $NFLX
  • When Elliott Waves applauds the promoter’s signals!

WaveTimes is a Research Organization dedicated to providing original analysis, reports, reviews, and insights on developments in mutual funds, stocks, investing, foreign exchange, commodities, and bonds.

Contact WaveTimes

L-601 Mantri Espana,

Kariyammana Agrahara, Bellandur, Bangalore 560103

Follow Us

  • Facebook
  • YouTube
  • Twitter

© 2023 Wave Times. All Rights Reserved.
  • About
  • Books
  • Privacy Policy
  • Policies and Standards

Type above and press Enter to search. Press Esc to cancel.