• About
  • Elliott Waves
    • Elliott Waves Explained
    • Elliott Wave Magic Illustrated with Wave Charts
    • Elliott Wave Edge – How Elliott Wave Traders Win
    • Fibonacci Number Series and Elliott Waves
    • How to use Fibonacci Ratio Retracements
    • Elliott Wave Books
      • The Elliott Wave Book – Five Waves to Financial Freedom
      • Dividend Growth Investing Using Elliott Waves
    • Videos
  • Equities
    • Indices
      • Africa
        • Egypt
      • Australia
      • European Indices
        • AEX – Index, Amsterdam
        • DAX Index
        • Istanbul
        • Russia
        • Spain’s IBEX 35
      • Asian Indices
        • India
        • China
        • Dubai
        • Kuwait
        • Kuala Lumpur
        • Pakistan
        • Saudi
        • Taiwan
      • US Indices
        • S&P500
        • Nasdaq
        • Dow Jones
        • Dow Jones Utilities
    • Stocks
      • Asian Stocks
        • Indian Stocks Trading
        • Dubai Stocks Outlook
        • Japanese Stocks
        • Kuwait stocks
        • Saudi Stocks Outlook
      • African Stocks
        • Egyptian Stocks
      • Swiss Stocks
      • Australian Stocks
      • European Stocks
      • US Stocks outlook
      • UK Stocks
  • Commodities
    • Copper
    • Gasoline
    • Gold
    • Natural Gas
    • Oil
    • Palm Oil
    • Raw Sugar
    • Rubber
    • Soybean Oil
    • Silver
  • Forex
    • AUD
    • Bitcoin
    • CAD
    • CHF
    • Euro
    • GBP
    • INR
    • NZD
    • JPY
  • Raves
  • Consulting
    • Consulting
  • Ramki’s Watchlist
Top News

Has Meta (Facebook) stock seen the bottom

March 21, 2022

What Is The Nearest Technical Support For Meta (NASDAQ: FB)

February 7, 2022

Using Elliott Waves to Capture a Trade in S&P500

January 27, 2022
Facebook Twitter Instagram
WaveTimes Blog WaveTimes Blog
Wave times
  • About
  • Elliott Waves
    • Elliott Waves Explained
    • Elliott Wave Magic Illustrated with Wave Charts
    • Elliott Wave Edge – How Elliott Wave Traders Win
    • Fibonacci Number Series and Elliott Waves
    • How to use Fibonacci Ratio Retracements
    • Elliott Wave Books
      • The Elliott Wave Book – Five Waves to Financial Freedom
      • Dividend Growth Investing Using Elliott Waves
    • Videos
  • Equities
    • Indices
      • Africa
        • Egypt
      • Australia
      • European Indices
        • AEX – Index, Amsterdam
        • DAX Index
        • Istanbul
        • Russia
        • Spain’s IBEX 35
      • Asian Indices
        • India
        • China
        • Dubai
        • Kuwait
        • Kuala Lumpur
        • Pakistan
        • Saudi
        • Taiwan
      • US Indices
        • S&P500
        • Nasdaq
        • Dow Jones
        • Dow Jones Utilities
    • Stocks
      • Asian Stocks
        • Indian Stocks Trading
        • Dubai Stocks Outlook
        • Japanese Stocks
        • Kuwait stocks
        • Saudi Stocks Outlook
      • African Stocks
        • Egyptian Stocks
      • Swiss Stocks
      • Australian Stocks
      • European Stocks
      • US Stocks outlook
      • UK Stocks
  • Commodities
    • Copper
    • Gasoline
    • Gold
    • Natural Gas
    • Oil
    • Palm Oil
    • Raw Sugar
    • Rubber
    • Soybean Oil
    • Silver
  • Forex
    • AUD
    • Bitcoin
    • CAD
    • CHF
    • Euro
    • GBP
    • INR
    • NZD
    • JPY
  • Raves
  • Consulting
    • Consulting
  • Ramki’s Watchlist
WaveTimes Blog WaveTimes Blog
Home » Elliott Wave Analysis of CAIRN India
Indian Stocks Trading

Elliott Wave Analysis of CAIRN India

RamkiBy RamkiMarch 13, 201115 Comments1 Min Read
Facebook Twitter LinkedIn Telegram Pinterest Tumblr Reddit WhatsApp Email
Share
Facebook Twitter LinkedIn Pinterest Email

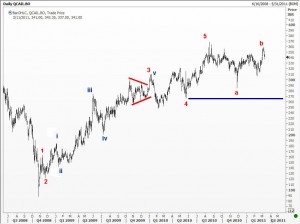
I thought I’d take a quick look at the chart of CAIRN india before shutting down for the upcoming holidays. But I ended up spending a good 30 minutes trying to decipher what was going on. At long last, I have come up with my best version and here is the bottom line. A five wave sequence is probably over, and we are just in the early stages of the C wave of teh correction. Take a look at the chart for the details.

Share. Facebook Twitter Pinterest LinkedIn Tumblr Telegram Email
Previous ArticleElliott Wave Analysis of USD/INR
Next Article Wrong-footed on DLF
Ramki
  • Website

Related Posts

When Elliott Waves applauds the promoter’s signals!

January 3, 2022

A soft quarter for TCS – Avoid or Add – Contd.

October 13, 2021

A soft quarter for TCS — Avoid or add?

October 12, 2021
View 15 Comments

15 Comments

  1. K P Ganesh on March 13, 2011 11:53 pm

    The road map shown for Cairn gives a perspective of what may happen, but with options open for alternative wave counts. Would there be a possibility that wave 5 could actual be forming now in the areas that you have marked as a-b-c in a complex 3-3-3-3-3 pattern ensuring an ending closer to the price target of 377 (summation series number).

    Reply
    • Ramki on March 14, 2011 2:58 am

      Ganesh, Anything is possible. But my view is we go lower towards the blue line

      Reply
  2. K P Ganesh on March 14, 2011 11:09 am

    Sir, but from today’s price move, in keeping with the positive news development on Vedanta been given the green signal by SEBI to acquire CAIRN, CAIRN seems to be in a 5 wave up move from the low of 306 made on Feb 10,2011. Currently we have declined 50% of wave 3 from 313.95 low made on Feb17,2011 to the intraday high of 359 on Mar08,2011. Clearly looks like the last leg i.e wave 5 is pending, which, if taken as per Wave theory guidelines of Wave A=Wave C, gives us a target of 363.15. At times we have seen Wave C extending as much as 1.618 times Wave A. So an alternate higher target of 379.25 emerges. So in my opinion in the very short term, maybe by this Friday (18/03/2011) we could be closing at or near 377.

    Reply
    • Ramki on March 14, 2011 10:20 pm

      Ganesh, Either we are in a correction, or in an impulse mode. If we are in a correction, an investor should wait for the correction to finish before he/she gets long on the stock. What you are saying is Wave c of the B wave is not over. Perhaps you are right. But it doesn’t change the outlook that we will eventually get a decline down to blue line. If we trade below 330 anytime, the odds increase for a direct move down.

      Reply
  3. vidhan dugar on March 15, 2011 7:04 am

    Sebi has not given green signal for the sale of CAIRN as on date.Please check http://www.sebi.gov.in.

    Reply
  4. K P Ganesh on March 16, 2011 2:33 am

    Mr. Ramki, I wish to thank as well as respond to Vidhan Dugar’s comments.

    At the time of my posting my comment on CAIRN, highlighting possible short term price target, NDTV Profit was airing the News flash of SEBI having given green signal to the Vedanta-CAIRN deal. The same appeared in Indian Express for which the link is here. http://www.indianexpress.com/news/sebi-retracts-says-cairn-deal-not-okayed/762250/. I’m enclosing an excerpt of SEBI’s initial action which is highlighted in the Indian Express.

    “Sebi’s official website this afternoon showed that the regulator has cleared Vedanta group’s Rs 13,610 crore open offer for acquiring 20 per cent stake in Cairn India. But soon after, the market regulator corrected the information, saying that the issue was still under process. ”

    Either ways, this news is inconsequential from Wave theory perspective. Actually it gives a perfect example of how ineffective news can be, to those who rely on news to make their trading decisions as well as highlighting how financial media would have been found wanting when such opposing news appear the same day, in spite of which price continues to move in the trend of larger degree albeit some volatility due to the news.

    Reply
  5. vidhan dugar on March 16, 2011 8:44 pm

    People following technical analysis should focus on technicals and not on positive news developments to support their view.Has the view changed after we know there was no new development ?

    Reply
    • Ramki on March 17, 2011 8:19 am

      Hi Vidhan, while what you say has an element of truth, one should also not be blind to developing conditions in the marketplace. This is especially true with wave analysis. A ‘C” wave can continue to be a ‘C’ wave, but a fresh piece of news can make the analyst decide that instead of an originally planned ‘Sell’ at an equality measure to wave’A’, it might be more appropriate to wait for either a 1.382XA or 1.618XA projection. From this point of view, I would urge traders to have an open mind about the markets. This is the right way to enter the market with low risk. Regards

      Reply
  6. Gautam Bajaj on March 17, 2011 6:58 am

    Hello Ramki,

    I agree with your views here.

    I have an initial target for C at 290-270

    Here is my post on Cairn – March 11th.

    http://wolfewaveindia.blogspot.com/search/label/Cairn

    Do take time off to visit my blog. I use wolfe wave’s to trade.

    I do also follow EW.

    Thanks
    Gautam

    Reply
  7. vidhan on April 6, 2011 12:49 am

    Rally in Cairn completed @ 375 levels (377-379 ..also suggested by Mr Ganesh .) Target 265…………..

    Reply
  8. vidhan dugar on June 2, 2011 2:19 am

    Dear Ramki,

    Cairn India(cmp 332) appears to be on the verge of cracking…. a close below 330 levels and ….

    Reply
    • Ramki on June 2, 2011 4:34 am

      Vidhan, 330 is important, but not sure we get an immediate breakdown

      Reply
  9. sunny on June 23, 2011 9:24 am

    sir .cud u plzz luk at charts of asian paints and titan ……..they both have been darling of indian stock market.

    regards
    sunny

    Reply
  10. vidhan dugar on August 5, 2011 12:31 am

    cairn made a low of 280 in eq segment , although it made a low of 252 in futures ….

    Reply
    • Ramki on August 7, 2011 1:08 am

      Hi Vidhan, I count you as one of those “Genuine” traders who live and breathe the markets! How else can I explain that you are keeping track of what I wrote so many months back…..

      Reply

Leave A Reply Cancel Reply

Recent Posts
  • Has Meta (Facebook) stock seen the bottom
  • What Is The Nearest Technical Support For Meta (NASDAQ: FB)
  • Using Elliott Waves to Capture a Trade in S&P500
  • Hedge Funds and Elliott Waves – Netflix $NFLX
  • When Elliott Waves applauds the promoter’s signals!

WaveTimes is a Research Organization dedicated to providing original analysis, reports, reviews, and insights on developments in mutual funds, stocks, investing, foreign exchange, commodities, and bonds.

Contact WaveTimes

L-601 Mantri Espana,

Kariyammana Agrahara, Bellandur, Bangalore 560103

Follow Us

  • Facebook
  • YouTube
  • Twitter

© 2023 Wave Times. All Rights Reserved.
  • About
  • Books
  • Privacy Policy
  • Policies and Standards

Type above and press Enter to search. Press Esc to cancel.