Today the news is Barclays Bank went to a three-month high on market optimism fueled by some nice numbers from US Bank Goldman Sachs. So I decided to take a look at what the charts tell us about Barclays.
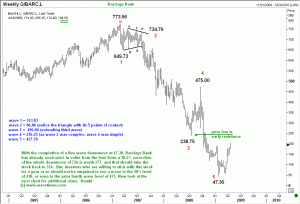
Like most other big banks, Barclays shares have been pounded. The stock fell from 773 to a mere 47. But hey, don’t you wish you had bought it at 47 because it has already quadrupled in value! But never mind, We can’t be aware of all the opportunities around us! So let us see what else one could do with Barclays.

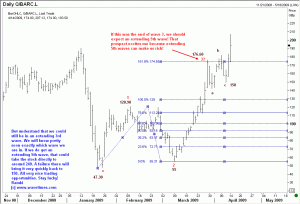
For starters, this move seems to have some legs. Assuming we get a fifth wave that extends all the way to 240 levels, then that should be where the stock could suffer exhaustion. A swift sell off should follow a fifth wave extension. (Extending fifth waves can be very profitable. For example, read this case study on USD/YEN)
If you are going to sit out the whole move for the time being, then that is also not a bad idea. You can always jump in for the THIRD wave move on the long side AFTER you get the sell-off that will hopefully follow a fifth wave extension.
Take a look at the two charts here, where I have given you Elliott Wave Analysis of Barclays Bank. If you are used to Twitting, then these comments are a great subject to alert your friends. Enjoy.

