• About
  • Elliott Waves
    • Elliott Waves Explained
    • Elliott Wave Magic Illustrated with Wave Charts
    • Elliott Wave Edge – How Elliott Wave Traders Win
    • Fibonacci Number Series and Elliott Waves
    • How to use Fibonacci Ratio Retracements
    • Elliott Wave Books
      • The Elliott Wave Book – Five Waves to Financial Freedom
      • Dividend Growth Investing Using Elliott Waves
    • Videos
  • Equities
    • Indices
      • Africa
        • Egypt
      • Australia
      • European Indices
        • AEX – Index, Amsterdam
        • DAX Index
        • Istanbul
        • Russia
        • Spain’s IBEX 35
      • Asian Indices
        • India
        • China
        • Dubai
        • Kuwait
        • Kuala Lumpur
        • Pakistan
        • Saudi
        • Taiwan
      • US Indices
        • S&P500
        • Nasdaq
        • Dow Jones
        • Dow Jones Utilities
    • Stocks
      • Asian Stocks
        • Indian Stocks Trading
        • Dubai Stocks Outlook
        • Japanese Stocks
        • Kuwait stocks
        • Saudi Stocks Outlook
      • African Stocks
        • Egyptian Stocks
      • Swiss Stocks
      • Australian Stocks
      • European Stocks
      • US Stocks outlook
      • UK Stocks
  • Commodities
    • Copper
    • Gasoline
    • Gold
    • Natural Gas
    • Oil
    • Palm Oil
    • Raw Sugar
    • Rubber
    • Soybean Oil
    • Silver
  • Forex
    • AUD
    • Bitcoin
    • CAD
    • CHF
    • Euro
    • GBP
    • INR
    • NZD
    • JPY
  • Raves
  • Consulting
    • Consulting
  • Ramki’s Watchlist
Top News

Has Meta (Facebook) stock seen the bottom

March 21, 2022

What Is The Nearest Technical Support For Meta (NASDAQ: FB)

February 7, 2022

Using Elliott Waves to Capture a Trade in S&P500

January 27, 2022
Facebook Twitter Instagram
WaveTimes Blog WaveTimes Blog
Wave times
  • About
  • Elliott Waves
    • Elliott Waves Explained
    • Elliott Wave Magic Illustrated with Wave Charts
    • Elliott Wave Edge – How Elliott Wave Traders Win
    • Fibonacci Number Series and Elliott Waves
    • How to use Fibonacci Ratio Retracements
    • Elliott Wave Books
      • The Elliott Wave Book – Five Waves to Financial Freedom
      • Dividend Growth Investing Using Elliott Waves
    • Videos
  • Equities
    • Indices
      • Africa
        • Egypt
      • Australia
      • European Indices
        • AEX – Index, Amsterdam
        • DAX Index
        • Istanbul
        • Russia
        • Spain’s IBEX 35
      • Asian Indices
        • India
        • China
        • Dubai
        • Kuwait
        • Kuala Lumpur
        • Pakistan
        • Saudi
        • Taiwan
      • US Indices
        • S&P500
        • Nasdaq
        • Dow Jones
        • Dow Jones Utilities
    • Stocks
      • Asian Stocks
        • Indian Stocks Trading
        • Dubai Stocks Outlook
        • Japanese Stocks
        • Kuwait stocks
        • Saudi Stocks Outlook
      • African Stocks
        • Egyptian Stocks
      • Swiss Stocks
      • Australian Stocks
      • European Stocks
      • US Stocks outlook
      • UK Stocks
  • Commodities
    • Copper
    • Gasoline
    • Gold
    • Natural Gas
    • Oil
    • Palm Oil
    • Raw Sugar
    • Rubber
    • Soybean Oil
    • Silver
  • Forex
    • AUD
    • Bitcoin
    • CAD
    • CHF
    • Euro
    • GBP
    • INR
    • NZD
    • JPY
  • Raves
  • Consulting
    • Consulting
  • Ramki’s Watchlist
WaveTimes Blog WaveTimes Blog
Home » Elliott Wave Analysis of Barclays Bank Plc
UK Stocks

Elliott Wave Analysis of Barclays Bank Plc

RamkiBy RamkiJuly 3, 201215 Comments1 Min Read
Facebook Twitter LinkedIn Telegram Pinterest Tumblr Reddit WhatsApp Email
Share
Facebook Twitter LinkedIn Pinterest Email

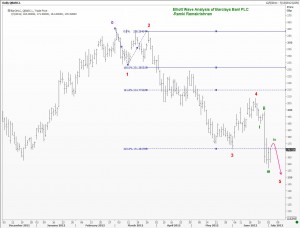
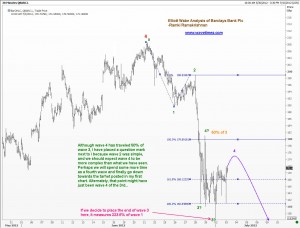
There is so much happening at Barclays Bank that I thought it deserves a look at the chart and see if we can get any clues. SO here you are..As always, please remember that WaveTimes in its current form is only sharing with you my knowledge of Elliott Wave Analysis. If you take the views as trading advice, you also need to know how to manage the positions and that does not figure here! If you wish to learn how to use Elliott Waves then you have my book “Five Waves to Financial Freedom”..
barclays
Share. Facebook Twitter Pinterest LinkedIn Tumblr Telegram Email
Previous ArticleElliott Wave Analysis of USD/INR (Indian Rupee)
Next Article Elliott Wave Update ~ 8 July 2012 ~ Nifty Index
Ramki
  • Website

Related Posts

Elliott Wave Analysis of CPER -ETF- United States Copper Index Fund

March 1, 2019

Using Elliott Waves to invest in Mid Caps

June 11, 2014

Easy pickings on EasyJet

October 1, 2012
View 15 Comments

15 Comments

  1. Abdul h. Asfoor on July 3, 2012 4:50 am

    Dear Mr.Ramki,
    I was wondering if you have subscription services for various market that you have at your website.
    Thank you,

    Reply
    • Ramki on July 3, 2012 8:02 am

      Hello Abdul, At present I am not offering any subscription based service on WaveTimes. It is all for free, because it is just a hobby for me – a medium to stay in touch with friends and followers from around the world. Some members of our club have known me for over 20 years! Even my book is priced very low for the same reason.I wrote it only to leave my name on the landscape…

      Reply
  2. abhay mehrotra on July 3, 2012 10:19 am

    Dear Sir,
    I am a trader who “now” trades for living and use EWP as main tool , i am encountering a main problem in trading on MCX ,on various contracts …. as due to USD-INR fluctuation the pattern in MCX are most of time quite different ,what exhibit in Comex , one classical example is Gold ……….here due to ruppe weakness we were making highs as compared to comex where gold was testing lower levels ………….please suggest how to cope up with this .

    Thanks & Regards
    Abhay Mehrotra

    Reply
    • Ramki on July 3, 2012 11:17 am

      Abhay, Elliott waves deals with crowd behavior. The crowd that trades on MCX is different from the crowd that trades Gold elsewhere. Each crowd is influenced by what happens in its own market. If arbitrage were possible between them, then the patterns would probably straighten out..so I would recommend studying the different markets separately, and count the waves for each market without getting influenced by what’s going on elsewhere. By the way the crowd is probably doing the mistake of anticipating a certain movement and suffer the emotional consequences of victory or disappointment. That will show up as waves!

      Reply
  3. Craig on July 3, 2012 11:08 am

    Barclays Banks CEO Resigns!

    Reply
  4. JG on July 4, 2012 10:51 pm

    Dear Ramki
    Thank you for your excellent update on Barclays. Is the impending fifth wave the end of a five waves down from the peak back in 2009 at approx 390.
    Many thanks and best regards
    JG

    Reply
    • Ramki on July 4, 2012 11:34 pm

      HI JG, If you go back in time to the March 2007 highs of 773.50, we have finished a five wave movement in Jan 2009 at 47.30. The recovery from that low is probably the first wave of a new medium term uptrend. At worst, that peak in 2009 itself can be deemed an A wave of a large correction. Hence once the current correction is completed, we shoudl look for a C wave rally. HOwever, the current correction itself could become a complex one, and the anticipated end of 5th wave could be one of teh minor 5-waves from around 260. Best to play it one step at a time for now.

      Reply
  5. itom112 on July 5, 2012 4:02 am

    Hello!
    I’m quiet new to stock and forex trading. After a few months I’ve found this Elliot Wave Theory, I really like it but I have one question that couldn’t be answered by google so far.
    So:
    Where do I start wave counting? In one video I’ve seen it was said that we always have to count the a-b-c correction waves before starting to count the next waves. And that the wave C ends no higher than the lowpoint of A.
    For me it means that on the first graph on this page IF there’s an uptrend until the 5th of march, than what you marked as the first and second wave would be the A and B waves of the correction . And the third correction wave lasts about until 2, April where the price crosses the Fibo 100 line. For me. And than I would start with W1 and so on…
    But on pictures and illustrations I see a lot that people start wave counting right at the top of the last 5 Waves (like here).
    So could you please tell me where to really start wave counting?

    Thanks In Advance!
    Tom

    Reply
    • Ramki on July 5, 2012 8:24 am

      Hello Tom, as you are new to Elliott Wave Theory and it’s practice, I recommend that you get hold of a good book first and learn the basics. Then you could look at the various examples in thus blog and that will strengthen your understanding. Good luck

      Reply
  6. Raj on July 5, 2012 8:54 pm

    Your call on HPQ was fantastic.

    Reply
    • Ramki on July 6, 2012 12:11 am

      Raj, thank you. You too can make similar trades!

      Reply
  7. ttlearn on July 6, 2012 7:24 am

    Hi Ramki,

    Thx for all the charts.
    Do you have a chart for PM (Gold/Slv), July/Aug is usually a seasonal low, wondering if you have thoughts on PM for rest of the year?

    Your JPM call is right on target.wow.

    One more Q, Are your EW rules based on Neely or Pretcher?

    thx

    Reply
    • Ramki on July 6, 2012 7:49 am

      Hi Ttlearn, thanks for your comments. My analysis is based on Ralph Elliott’s theory.

      Reply
  8. cwave on July 7, 2012 11:02 pm

    Hi Ramki,

    Not sure how you select a security to analyze,
    here is one that could be completing a C and ready to fall off the cliff.
    WFM (Whole foods) good probability? any thoughts,

    thanls

    Reply
  9. Ramki Ramakrishnan on July 8, 2012 3:44 am

    Hello CWave! I think Whole Foods has at least another 8% to the upside, and would use dips to buy! If you get a lucy dip directly to 91 (or better still 87) buy some for one more move up. I would also recommend you to read my book FWTFF because you will then see that there isnt a C wave in the making, rather we are probably in the 4th of an extended fifth wave.

    Reply

Leave A Reply Cancel Reply

Recent Posts
  • Has Meta (Facebook) stock seen the bottom
  • What Is The Nearest Technical Support For Meta (NASDAQ: FB)
  • Using Elliott Waves to Capture a Trade in S&P500
  • Hedge Funds and Elliott Waves – Netflix $NFLX
  • When Elliott Waves applauds the promoter’s signals!

WaveTimes is a Research Organization dedicated to providing original analysis, reports, reviews, and insights on developments in mutual funds, stocks, investing, foreign exchange, commodities, and bonds.

Contact WaveTimes

L-601 Mantri Espana,

Kariyammana Agrahara, Bellandur, Bangalore 560103

Follow Us

  • Facebook
  • YouTube
  • Twitter

© 2023 Wave Times. All Rights Reserved.
  • About
  • Books
  • Privacy Policy
  • Policies and Standards

Type above and press Enter to search. Press Esc to cancel.