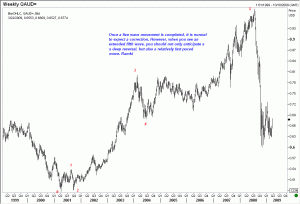
This page gives you an example how one could use Elliott Wave Analysis to trade AUD/USD or the Australian Dollar. It was back in April 2001 that the Australian Dollar commenced its bull market run from a low of 0.4773. It took just over seven years for it to peak (in July 2008) at 0.9849. Clearly, the move was not a straight-line move. But even by looking at the weekly chart shown below, one can spot Elliott at work.
When the fifth wave of a progression is an extended wave, you should be prepared for a sharp reversal
There whole up-move is comprised of five waves, including two corrective waves. Interestingly, once the five waves were completed, we got a very sharp sell off, all the way down to 0.6004. Believe it or not, the downmove took less than four months to wipe out gains that took over five years. If you had a knowledge of the Wave Principle, you could have easily anticipated the depth of this correction, and taken some profitable trading decisions. Here is your chart of AUD/USD (Australian Dollar) with the Elliott Wave labels.


