• About
  • Elliott Waves
    • Elliott Waves Explained
    • Elliott Wave Magic Illustrated with Wave Charts
    • Elliott Wave Edge – How Elliott Wave Traders Win
    • Fibonacci Number Series and Elliott Waves
    • How to use Fibonacci Ratio Retracements
    • Elliott Wave Books
      • The Elliott Wave Book – Five Waves to Financial Freedom
      • Dividend Growth Investing Using Elliott Waves
    • Videos
  • Equities
    • Indices
      • Africa
        • Egypt
      • Australia
      • European Indices
        • AEX – Index, Amsterdam
        • DAX Index
        • Istanbul
        • Russia
        • Spain’s IBEX 35
      • Asian Indices
        • India
        • China
        • Dubai
        • Kuwait
        • Kuala Lumpur
        • Pakistan
        • Saudi
        • Taiwan
      • US Indices
        • S&P500
        • Nasdaq
        • Dow Jones
        • Dow Jones Utilities
    • Stocks
      • Asian Stocks
        • Indian Stocks Trading
        • Dubai Stocks Outlook
        • Japanese Stocks
        • Kuwait stocks
        • Saudi Stocks Outlook
      • African Stocks
        • Egyptian Stocks
      • Swiss Stocks
      • Australian Stocks
      • European Stocks
      • US Stocks outlook
      • UK Stocks
  • Commodities
    • Copper
    • Gasoline
    • Gold
    • Natural Gas
    • Oil
    • Palm Oil
    • Raw Sugar
    • Rubber
    • Soybean Oil
    • Silver
  • Forex
    • AUD
    • Bitcoin
    • CAD
    • CHF
    • Euro
    • GBP
    • INR
    • NZD
    • JPY
  • Raves
  • Consulting
    • Consulting
  • Ramki’s Watchlist
Top News

Has Meta (Facebook) stock seen the bottom

March 21, 2022

What Is The Nearest Technical Support For Meta (NASDAQ: FB)

February 7, 2022

Using Elliott Waves to Capture a Trade in S&P500

January 27, 2022
Facebook Twitter Instagram
WaveTimes Blog WaveTimes Blog
Wave times
  • About
  • Elliott Waves
    • Elliott Waves Explained
    • Elliott Wave Magic Illustrated with Wave Charts
    • Elliott Wave Edge – How Elliott Wave Traders Win
    • Fibonacci Number Series and Elliott Waves
    • How to use Fibonacci Ratio Retracements
    • Elliott Wave Books
      • The Elliott Wave Book – Five Waves to Financial Freedom
      • Dividend Growth Investing Using Elliott Waves
    • Videos
  • Equities
    • Indices
      • Africa
        • Egypt
      • Australia
      • European Indices
        • AEX – Index, Amsterdam
        • DAX Index
        • Istanbul
        • Russia
        • Spain’s IBEX 35
      • Asian Indices
        • India
        • China
        • Dubai
        • Kuwait
        • Kuala Lumpur
        • Pakistan
        • Saudi
        • Taiwan
      • US Indices
        • S&P500
        • Nasdaq
        • Dow Jones
        • Dow Jones Utilities
    • Stocks
      • Asian Stocks
        • Indian Stocks Trading
        • Dubai Stocks Outlook
        • Japanese Stocks
        • Kuwait stocks
        • Saudi Stocks Outlook
      • African Stocks
        • Egyptian Stocks
      • Swiss Stocks
      • Australian Stocks
      • European Stocks
      • US Stocks outlook
      • UK Stocks
  • Commodities
    • Copper
    • Gasoline
    • Gold
    • Natural Gas
    • Oil
    • Palm Oil
    • Raw Sugar
    • Rubber
    • Soybean Oil
    • Silver
  • Forex
    • AUD
    • Bitcoin
    • CAD
    • CHF
    • Euro
    • GBP
    • INR
    • NZD
    • JPY
  • Raves
  • Consulting
    • Consulting
  • Ramki’s Watchlist
WaveTimes Blog WaveTimes Blog
Home » Elliott Wave Analysis of Agilent Technologies Inc
US Stocks outlook

Elliott Wave Analysis of Agilent Technologies Inc

RamkiBy RamkiFebruary 17, 20134 Comments1 Min Read
Facebook Twitter LinkedIn Telegram Pinterest Tumblr Reddit WhatsApp Email
Share
Facebook Twitter LinkedIn Pinterest Email

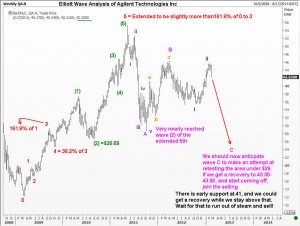
Agilent Technologies was cut to sell vs hold by some analyst last week. However, that is not what triggered a 5.23% sell off on Friday, making it the worst performer of the S&P500 index. It could be the fact that a correction of the 1st leg down as shown in the attached chart is already completed, and so we could have embarked on the 3rd leg down. Any regular reader of these pages would know that whether it is a 3rd wave, or a C wave, the price of teh security concerned will move rapidly.

My comments are posted on the chart as usual, because why say more when you could accomplish the same with fewer words? Take care. Ramki

Share. Facebook Twitter Pinterest LinkedIn Tumblr Telegram Email
Previous ArticleTASI MAGIC
Next Article Elliott Wave Analysis of EOG Resources Inc (NYSE: EOG
Ramki
  • Website

Related Posts

Has Meta (Facebook) stock seen the bottom

March 21, 2022

What Is The Nearest Technical Support For Meta (NASDAQ: FB)

February 7, 2022

Hedge Funds and Elliott Waves – Netflix $NFLX

January 17, 2022
View 4 Comments

4 Comments

  1. daniel on February 17, 2013 7:28 pm

    I love your work,

    I have a question, would the trading technique suggestions written in the chart be the same for a short term trader and a long term trader? And if not, what would be your recommended approach for long term trader?

    I am guessing that depending of the type of trading that it is being done, the use of the Elliot Wave levels varies…

    My own thinking: If now it is about 42, to 41 ,possible level of rebound, the risk reward from the point of view of a medium to long term trader that read the chart only end of day, is relatively poor, as it can revisit 43 anytime. Waiting to short from 43 it improves the ratio but not much, to 41. And even then it can go back to revisit 45 in the next months prior to continuing its fall. For day traders it is different, with their 60 minute charts, glued to the computer, they can follow the fall from 43 to 41 and make a 5% in a short period of time

    Have a good weekend,
    Daniel

    Reply
    • Ramki Ramakrishnan on February 24, 2013 9:09 am

      Hi Daniel
      Thank you for writing. Yes, while EWP works on all time frames, the day-trader’s strategy and tactics would be different from the medium term players partly due to the reasons outlined by you. The main concern for the day trader would be how to navigate the various twists and turns and unexpected short-term formations that are bound to show up as the market moves. For the medium term player, the concern is more how to manage his position without being too active in the market.

      Reply
  2. Merakshi on February 18, 2013 12:03 am

    Dear Ramki

    Thank you for that analysis.
    I am wondering why you have not labeled wave (1) as 5 (red)?

    Best Regards
    Merakshi

    Reply
    • Ramki Ramakrishnan on February 24, 2013 9:19 am

      HI Merakshi, Labeling waves is all a matter of judgement at the time. Even if you label something incorrectly, you will know soon enough about your mistake and exit your trade quickly at the first sign of trouble.

      Reply

Leave A Reply Cancel Reply

Recent Posts
  • Has Meta (Facebook) stock seen the bottom
  • What Is The Nearest Technical Support For Meta (NASDAQ: FB)
  • Using Elliott Waves to Capture a Trade in S&P500
  • Hedge Funds and Elliott Waves – Netflix $NFLX
  • When Elliott Waves applauds the promoter’s signals!

WaveTimes is a Research Organization dedicated to providing original analysis, reports, reviews, and insights on developments in mutual funds, stocks, investing, foreign exchange, commodities, and bonds.

Contact WaveTimes

L-601 Mantri Espana,

Kariyammana Agrahara, Bellandur, Bangalore 560103

Follow Us

  • Facebook
  • YouTube
  • Twitter

© 2023 Wave Times. All Rights Reserved.
  • About
  • Books
  • Privacy Policy
  • Policies and Standards

Type above and press Enter to search. Press Esc to cancel.