Below is an example of how I helped a short term trader in cash GOLD. Elliott Waves works just as well in the short term as in the medium to long term. It all depends on which cycle you are trading.
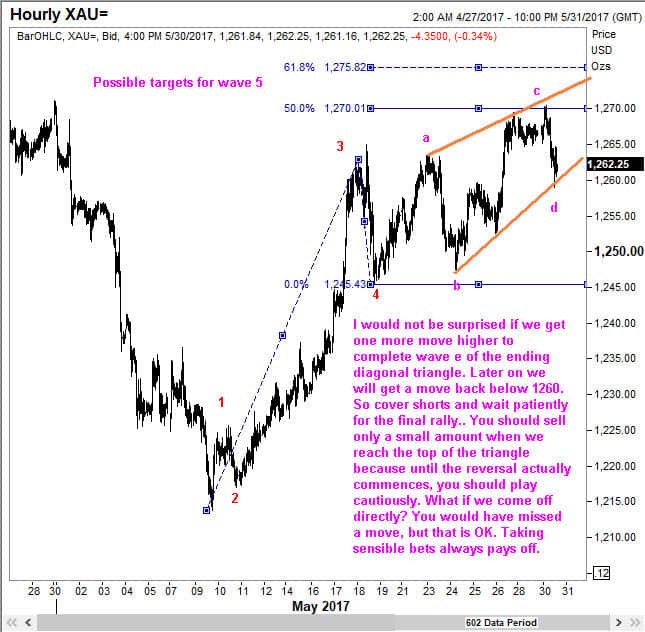
The following is one of the charts that I had sent my client on 30 May 2017. You can see that this was a hourly chart, captured at 4 pm when the price was at 1262.25. This client was short Gold at 1270 and wanted my Elliott Wave analysis to help navigate next steps.
Here is what happened to Gold (XAU/USD) after that.
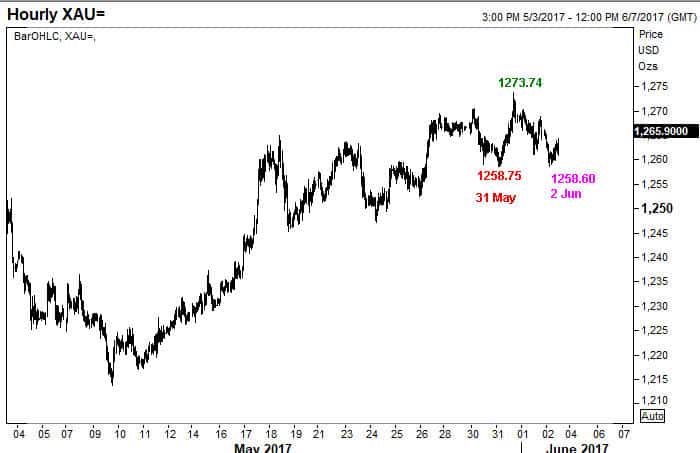
You may think that is all well, but Gold rallied sharply to 1295 after that! Well, the analysis did actually discuss that move. But I will publish that at a later date. Perhaps you might be interested in Comex Gold? The next image is one of the charts from another consulting engagement for Comex Gold. This was sent out on 5 June 2017 when Gold was trading at 1279.
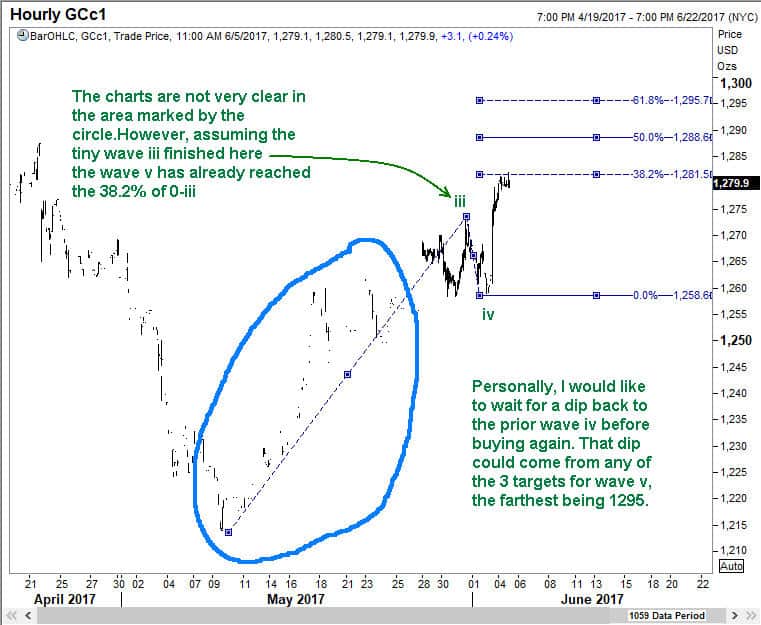
And as you probably know, Gold went exactly to 1295 and has come off to 1264.
A lot could be done with information such as this. For example, you could have sold aggressively at 1295 with a close by stop, or you could have covered your shorts at 1260 and even tried a long. With a proper strategy, you will have an edge. And that is what I called smart trading. You get that advantage with WaveTimes.
