Today’s FT carries an interesting report filed by Miles Johnson, their Hedge Fund Correspondent. This report says that Seth Klarman, one of the most respected investors, has raised the alarm over a looming asset price bubble, and specifically mentions Tesla Motors , (TSLA:NSQ). He has warned of the potential for a brutal correction across financial markets. See this link: Seth Klarman warns of asset price bubble
So I decided to check out the charts for Tesla Motors to see if Elliott Waves could offer us additional clues that might help us play along with the view professed by Mr Klarman.
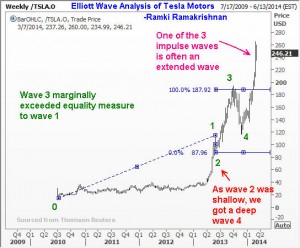
Take a look at the first chart below. It clearly shows that we are in the fifth wave of a move that stated back in Q3 of 2010. According to the Elliott Wave Principle, it is normal for one of the three impulse waves within a five wave sequence to be extended, i.e. for it to move a greater distance than the other two impulse waves. The chart below shows that the first and third waves were roughly equal is measure (i.e. they were of ‘normal’ proportions). This also ties in with another feature of Elliott’s observations that often enough, two impulse waves tend to be equal in dimensions. You will also observe the principle of alternation in the two corrective waves seen, whereby when wave 2 was shallow, we got a wave 4 that was deep.
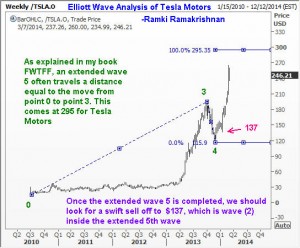
The next chart shows how to anticipate a possible end point for wave 5. Because we are expecting wave 5 to be extended, one possible terminal point is at a place where wave 5 would have traveled a distance equal to that from point 0 to point 3. This comes at $295.
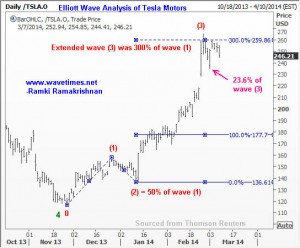
We will now zoom in to the fifth wave and see if the sub waves of the fifth wave can give us additional information. As you probably know, every impulse wave is composed of its own set of five sub waves. We can immediately see that sub wave (3) was extended to reach about 300% of sub wave (1). Wave (2) was 50% of wave (1) and wave (4) has already corrected to a 23.6% measure of wave (3). All these Fibonacci Ratios are common measures used by Elliott Wave Analysts to add confidence to their reading of the waves.
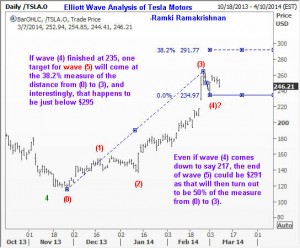
The final chart below uses the technique I have described in my book “Five Waves to Financial Freedom” where we measure the distance form point (0) to point (3) and compute a 38.2% and a 50% measure. These measures, when added to the bottom of wave (4) will give us potential targets for wave (5). Interestingly, if we add a 38.2% measure to wave (4) at 235, the target comes just below $295 which we already saw earlier. And should wave (4) come down some more to reach a 38.2% correction of wave (3) – that is reach $217, then we will get wave (5) to land at 291 if we add a 50% measure of (0) to (3).
Because of these confluences, we should go with the belief that there is a high probability for Tesla Motors to complete its extended fifth wave just below $295 and commence a very sharp decline that can take it all the way down to $137. This is the level where the extended fifth wave had its sub wave (2) end. There are numerous illustrations of this phenomenon explained in this blog as well as in my book so much so that I have often informed readers that fifth wave extensions can make us rich! Good luck and happy hunting.
18 Comments
Thanks Ramki. I was looking for my exit point on TESLA, your analysis on the same helps me fix my target price. I greatly appreciate your work.
Dear Ramki,
Thanks for your analyze. I use to watch your analyzes and I even bought your book, however I noticed, that you don’t use the semi-logarithmic scales (in Robert Prechter’s book there is a recommendation for using semi-log scales mainly for larger degrees). In such perspective the picture is completely other particularly for estimation of wave 1 and 2. In my point of view it looks rather more realistic, because the w1 and w2 is not in the middle of the strongest swing, which use to be significant for wave 3. Finally I have marked the end of wave 3, 4 as well as expected 5 in the same position as in your graph, but in my semi-log version w3 is 200% of w1, w4=23% of w4 and w5 expecting equal to w1.
Can you tell me please your opinion regarding where or when to use semi-log scales?
Regards, Fero
Hello Ferro, My suggestion is not to bother comparing different charts using different scales. Go with what you are comfortable with, determine your trade, decide your tactics, and put the money to the market when the risk-reward trade off is good. That is the best way to use Elliott Waves. Rest of the activity is all arm-chair analysis.Good luck.
Hi Ramki, So far Tesla has price 208 which is 4th of 5th within the extended (5)th wave. Your analysis is very transparent and useful. Thank you for sharing.
Mahesh, it looks like that high was actually the end of wave 5, but that wasnt apparent without our hindsight!
Hi,
I am half way through reading your book. I wanted to apply the buy strategy given in chapter 5. In your book it reads “As you spot the tentative end of a correction, you will notice a reflex point in the final stages of the move that is ending. This will probably be the 4th wave end within the fifth wave of the correction that is almost over.”
You are calling this the reflex point. My question is: Is this the 4th wave within 5th wave of C wave OR just the 4th wave within C wave. In other words are you talking about wave that is 2 degrees lower or just 1 degree lower than the primary wave which is to be traded? Please clarify.
Larry
It is seldom easy to know that we are back in an impulse wave (after a correction). So we use these clues. If you did spot wave 4 of the fifth wave of the C, then you have spotted it early enough to allow a small stop loss. If you spot the recovery going past wave 4 of the C itself, then the stop on your purchase will be farther away. In the second case, the rally would have already gone past wave 4 of the 5th subwave of the C wave! Hope this helps.
Hi Ramki,
I am immensely benefited by your book as well as the premium services.
One basic query : Is it compulsory for wave 1 ( or for that matter any impulse wave) to sub-divide into 5 waves in the same time frame ? ( or is it OK to zoom into a lower time-frame to look for subdivisions ?)
Regards
Vijay
Hi Vijay, Often, you may not be able to make out the sub waves in a strong impulse wave. At those times, it is useful to get clarity by going down to the lower time frame charts.
Hello Ramki,
I have a query ?
In expanded Flat. till how much percentage wave B can retrace compared to wave A. Is it upto 138.2% or 161.8% ?
Mujahid, the relationship of Wave B to Wave A in an expanded flat is not defined. You should look at how far below the bottom of wave A that wave B has traveled and use that to determine targets for C. Also, you would not know that it in an expanded until teh reversal starts happening. So why do you need a target for wave B?
I got this doubt during labelling of wave counts. while indentifying wave 4 end, sometimes i’m stumbling with 161.8% wave B retracements and wave C ends before the start of wave B. In these cases shall I consider it as wave 4 only or subwave 1 of wave 5 ?
Mujahid, I am not sure that I completely understand your question as you seem to have got the labels wrong. May I suggest that you revisit the FWTFF book and most likely your doubts will be dispelled.
This time around you are expecting it to reach wave 2 of 5 but generally it is said that the probable end of correction is near 4th of 5th. Ramki, Why you expect in this case the prices to fall till subwave 2 of 5? Is it because 5th was extended in this case.
Mahesh, As explained in FWTFF book, upon completion of an extended 5th wave, a most likely first port of call for the ensuing correction is wave 2 of the 5th
Ramki, is it correct for TSLA that 5 of primary 1 has ended at $263 and primary wave 2 is underway? A of 2 completed at $184
Tim, Observe that the down move from the peak has marginally exceeded the distance covered by wave 4. This is a wonderful fulfillment of Elliott Wave Principle which says that once a 5 wave move is completed, the ensuing correction will be bigger and last longer than either of the 2 preceding corrections. As for your question, yes, it does look like we have only done one part of the correction, if not for anything else, but the correction seems inadequate considering the size of the 5-wave move that preceded it! So maybe we will get to see 165 after some back and forth movements.
In retrospect, it is now 2016, you were right on in your analysis. Is there a more current EW analysis of Tesla? Thank you. It is infrequent to find such an exact hit. Thank you again.