• About
  • Elliott Waves
    • Elliott Waves Explained
    • Elliott Wave Magic Illustrated with Wave Charts
    • Elliott Wave Edge – How Elliott Wave Traders Win
    • Fibonacci Number Series and Elliott Waves
    • How to use Fibonacci Ratio Retracements
    • Elliott Wave Books
      • The Elliott Wave Book – Five Waves to Financial Freedom
      • Dividend Growth Investing Using Elliott Waves
    • Videos
  • Equities
    • Indices
      • Africa
        • Egypt
      • Australia
      • European Indices
        • AEX – Index, Amsterdam
        • DAX Index
        • Istanbul
        • Russia
        • Spain’s IBEX 35
      • Asian Indices
        • India
        • China
        • Dubai
        • Kuwait
        • Kuala Lumpur
        • Pakistan
        • Saudi
        • Taiwan
      • US Indices
        • S&P500
        • Nasdaq
        • Dow Jones
        • Dow Jones Utilities
    • Stocks
      • Asian Stocks
        • Indian Stocks Trading
        • Dubai Stocks Outlook
        • Japanese Stocks
        • Kuwait stocks
        • Saudi Stocks Outlook
      • African Stocks
        • Egyptian Stocks
      • Swiss Stocks
      • Australian Stocks
      • European Stocks
      • US Stocks outlook
      • UK Stocks
  • Commodities
    • Copper
    • Gasoline
    • Gold
    • Natural Gas
    • Oil
    • Palm Oil
    • Raw Sugar
    • Rubber
    • Soybean Oil
    • Silver
  • Forex
    • AUD
    • Bitcoin
    • CAD
    • CHF
    • Euro
    • GBP
    • INR
    • NZD
    • JPY
  • Raves
  • Consulting
    • Consulting
  • Ramki’s Watchlist
Top News

Has Meta (Facebook) stock seen the bottom

March 21, 2022

What Is The Nearest Technical Support For Meta (NASDAQ: FB)

February 7, 2022

Using Elliott Waves to Capture a Trade in S&P500

January 27, 2022
Facebook Twitter Instagram
WaveTimes Blog WaveTimes Blog
Wave times
  • About
  • Elliott Waves
    • Elliott Waves Explained
    • Elliott Wave Magic Illustrated with Wave Charts
    • Elliott Wave Edge – How Elliott Wave Traders Win
    • Fibonacci Number Series and Elliott Waves
    • How to use Fibonacci Ratio Retracements
    • Elliott Wave Books
      • The Elliott Wave Book – Five Waves to Financial Freedom
      • Dividend Growth Investing Using Elliott Waves
    • Videos
  • Equities
    • Indices
      • Africa
        • Egypt
      • Australia
      • European Indices
        • AEX – Index, Amsterdam
        • DAX Index
        • Istanbul
        • Russia
        • Spain’s IBEX 35
      • Asian Indices
        • India
        • China
        • Dubai
        • Kuwait
        • Kuala Lumpur
        • Pakistan
        • Saudi
        • Taiwan
      • US Indices
        • S&P500
        • Nasdaq
        • Dow Jones
        • Dow Jones Utilities
    • Stocks
      • Asian Stocks
        • Indian Stocks Trading
        • Dubai Stocks Outlook
        • Japanese Stocks
        • Kuwait stocks
        • Saudi Stocks Outlook
      • African Stocks
        • Egyptian Stocks
      • Swiss Stocks
      • Australian Stocks
      • European Stocks
      • US Stocks outlook
      • UK Stocks
  • Commodities
    • Copper
    • Gasoline
    • Gold
    • Natural Gas
    • Oil
    • Palm Oil
    • Raw Sugar
    • Rubber
    • Soybean Oil
    • Silver
  • Forex
    • AUD
    • Bitcoin
    • CAD
    • CHF
    • Euro
    • GBP
    • INR
    • NZD
    • JPY
  • Raves
  • Consulting
    • Consulting
  • Ramki’s Watchlist
WaveTimes Blog WaveTimes Blog
Home » Easy Trade in ICICI Bank stock
Indian Stocks Trading

Easy Trade in ICICI Bank stock

RamkiBy RamkiJanuary 3, 201238 Comments1 Min Read
Facebook Twitter LinkedIn Telegram Pinterest Tumblr Reddit WhatsApp Email
Share
Facebook Twitter LinkedIn Pinterest Email

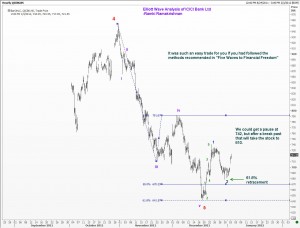
ICICI Bank stock chartIn my last Elliott Wave update for Indian stocks, I pointed out that ICICI bank was approaching a buy zone. At that time, I was suggesting buying in stages from 620, but you could have done better and purchased at 642 if you had followed the methods described in Five Waves to Financial Freedom. There are so many low-risk opportunities around that all one has to do is to spend the requisite time to do the research! Take a look at this chart that shows how you could have computed the end of the fifth wave of the C.
P.S. There is no change in my recommendation on L&T, if you are long, you should exit that stock on any recovery, perhaps even a tad sooner than 1190

ICICI Bank
Share. Facebook Twitter Pinterest LinkedIn Tumblr Telegram Email
Previous ArticleHappy New Year
Next Article Ramki Ramakrishnan on Forbes
Ramki
  • Website

Related Posts

When Elliott Waves applauds the promoter’s signals!

January 3, 2022

A soft quarter for TCS – Avoid or Add – Contd.

October 13, 2021

A soft quarter for TCS — Avoid or add?

October 12, 2021
View 38 Comments

38 Comments

  1. vritika on January 3, 2012 1:27 am

    SIR,when should i buy bhel or is there any other stock for one to two months.

    Reply
    • Ramki on January 3, 2012 2:39 am

      Hello Vritika, Thank you for your question. I am not offering any trade advice at present. WaveTimes is a place where you can learn how to use Elliott Wave Analysis, and after a while, you too can spot low-risk opportunities. Good luck.

      Reply
  2. Gaurav on January 3, 2012 8:31 am

    Sir,
    I am a little confused here …”fifth wave of the C ?” how are you computing 742 and 810 – I am seriously lost – kindly explain
    Btw – kudos on the book – I think it should be distributed for free so people can stop complaining about losing money. Also got a silly joke if its worth publishing
    “The 5WTFf” 😉
    Happy New Year and best wishes
    Gaurav

    Reply
    • Ramki on January 3, 2012 12:03 pm

      Hi Gaurav, Today’s chart shows the breakdown of the fifth wave within the C, and how the terminal point of that fifth wave could have been anticipated. The key point is ICICI is rallying nicely from that target.

      Reply
  3. billk on January 3, 2012 11:54 am

    The chart indicates a possiblity for 810 if ICICI. I presume that is in INR’s. WHen I do the US $ conversion it is approx $15.

    The US ADR for ICICI is IBN and it is approx US$28.26. That is approx 1504 INR.

    Do I have the wrong US stock (ADR) for ICICI?

    Reply
    • Ramki on January 3, 2012 12:06 pm

      Hello Billk, Let me come back to you on this tomorrow!

      Reply
    • Satya on January 4, 2012 12:13 am

      One ADR is 2 shares.
      Here is the link http://www.icicibank.com/aboutus/investor-faq.html#5

      Reply
    • Ramki on January 4, 2012 3:29 am

      Hi Billk, You have the correct ticker for ICICI Bank’s ADR. The charts for the Indian stock and the ADR are identical. Obviously, you cannot apply the current USD/INR exchange rate to convert the prices. But my projections in percentage terms for the Indian stock should work on the US ADR. Good luck

      Reply
  4. Santosh on January 3, 2012 12:32 pm

    Hi Ramki,
    I have read your book. My basic queries is I cant find out when to count A-B-C and W-X-Y and W-X-Y-X-Z when we are in correction phase. Can you please explain this with target of each wave (i.e retracement from its previous wave)

    Thanks in advance….

    Reply
    • Ramki on January 3, 2012 8:09 pm

      Hi Santosh, first of all you should know the concept of alternation. Then you should realize that with complex corrections it is impossible to predict the pattern it will take. It is just a matter of intuition. Finally, in my book, I never used w,x,y,z because it complicates matters. I use abc x abc x abc. One can use any symbol to separate the waves. It is your choice

      Reply
  5. Dr Sanjay Pote on January 3, 2012 8:06 pm

    Sir, thanks for the ICICI chart. I got your Ebook yesterday night and could not keep it down—absolutely simple and practical. 1 thing I am confused about is whether Nifty has bottomed out. Since I am short on many stoks I will be highly obliged if you answer my query soon.
    Regards and Happy New Year
    Sanjay

    Reply
    • Ramki on January 3, 2012 8:11 pm

      Hi dr Sanjay , if it closes above 4780 it will move up some more

      Reply
  6. Amar on January 4, 2012 7:45 am

    Thanks for the view on ICICI and i was benefited in it. I was long from 650 and covered at 721 1 lot.
    Is there any software which works on the ELLIOTT WAVE theory? if not you can think of inventing the one and off course you will gain by getting the royalty for that.

    Reply
    • Ramki on January 4, 2012 11:45 am

      Hi Amar, I am glad you had a good trade, but never become
      become complacent. No, there are no reliable software
      that I know of and I am having a hard time even maintaining
      this blog. In any case EWP cannot be constrained by
      any algorithm of a software. Good luck.

      Reply
  7. Santosh on January 4, 2012 8:46 am

    Thanks Ramki….

    I am having query related to ICICI bank elliot wave analysis which you did. First of all thanks for providing such a accurate analysis.

    Query-When you published the analysis of ICICI bank its in wave C which is an impulse wave consist of 5 subwaves. these 5 subwaves were not completed at the time you published the chart. Of course after completing the 5 subwaves we can expect a bounce but how you are sure that it will wave 1 (consist of subwave 5) and not wave X (consist of subwave 3). It might possible that ICICI bank is still in correction mode of wave X which in turn consist of wave a-b-c.

    How i will upload the charts if i have queries regarding charts which i have analysed.

    Thanks

    Reply
    • Ramki on January 4, 2012 11:28 am

      Hi Santosh, first of all there is no guarantee that anyone’s count is accurate until the move is over. So you just trade your theory until proved wrong. Wavetimes teaches you how to do that. You can post ur charts on the forum. Good luck.

      Reply
  8. Vivek Agrawal on January 4, 2012 9:56 am

    Hi Ramki,

    I have started reading your book .. so pardon me if I am asking a naiive question. Why is the current upmove 1,2,3,4,5 and not A,B,C?

    Thanks!
    Vivek

    Reply
    • Ramki on January 4, 2012 11:36 am

      Hi Vivek, let me come back to you tomorrow as I have to look at the chart again. Responding while shopping at the mall!

      Reply
      • Sri on January 5, 2012 7:22 am

        Ramki, looking forward for your comments to the Vivek question. I also thought about what if the up move is an ABC, then i told my self that 100 % of the first wave in this up move comes around 780 and 138% comes around 814, so may be we need to re look at the charts those levels or watch charts for smaller time frames? It’s taking me a while to post my question, and i could imagine how much time you require to answer all the questions here, I appreciate once again for taking your time and helping us to learn.

        Sri

        Reply
  9. Fabrizio on January 5, 2012 2:47 am

    Hi Ramki! First of all my compliments! You are fantastic!
    A small question! How Elliot Waves manage the fundamental news?
    That is for instance. If you are reading a chart of Eur-Usd and you
    think to be in a 3rd wave (LONG) can a fundamental bad new
    of Eur transport at once directly to a 4th wave (SHORT)?
    Which are the rules in these cases?
    I think this question is interesting also for all readers
    My best greetings and wishes from an usual reader of yours!

    Reply
    • Vivek Agrawal on January 5, 2012 8:21 am

      Pardon me for responding even though you did not ask readers to respond. News justifies the moves that have already happened. News do not create moves. Usually market action is preceded by news. If you don’t believe me, please check it for yourself.

      Thanks,
      Vivek

      Reply
  10. Dinesh Kumar Bohre on January 7, 2012 10:09 am

    Hi Vivvek, Fabrizio,

    News does impact the market, it depends what real weight it carries.

    To be more accurate,during 3rd wave in an uptrend, market ignores bearish news altogether, so it answers the exact question about ‘3rd wave’ by Fabrizio.

    On the other hand, 5th wave can be extended (to go much beyond usual target) or truncated (to cut even before high of wave 3 – the previous actionary wave) – it largely depends upon market sentiment.

    Reply
  11. Santosh on January 7, 2012 11:02 am

    Hi Ramki Sir,
    Can you please give your view on Videocon Industries please atleast trend…

    Thanks

    Reply
    • Ramki on January 8, 2012 2:06 am

      Hello Santosh, Yes, I received your request for comments on Videocon Industries. Unfortunately, I am currently not offering such a service.Anyway, I think we have a reasonably good chance for higher prices in this stock and will look to buy dips for a move to 195

      Reply
      • Santosh on January 8, 2012 8:43 am

        Ramki Sir,
        Can you please explain below
        After completing the wave 5
        1. How far wave A can travel
        2. How far A-B-C correction will go.
        I know its difficult to answer but please share your experience with us. You must have seen so meany bear phases what do you think were correction will end
        specially when below are the cases
        1. wave 1 extended and then were wave 2 correction will end
        2. wave 3 extended and then were wave 4 correction will end
        3. wave 5 extended and then were wave A-B-C correction will end

        Thanks in advance….

        Reply
        • Ramki on January 8, 2012 11:59 am

          Hi Santosh, your best bet is to buy a good book that explains
          Elliott wave principle !

          Reply
  12. sandy on January 7, 2012 11:14 am

    Sir where can i buy your book?

    Reply
    • Ramki on January 7, 2012 8:02 pm

      Hi Sandy, click on the picture of the book on the right side and read the page you are taken to.

      Reply
      • Sandy on January 8, 2012 8:39 am

        Thanks Sir bought the book

        Reply
        • Ramki on January 8, 2012 12:03 pm

          Sandy, welcome to the club!

          Reply
  13. Gaurav on January 8, 2012 12:55 am

    Sir,
    quick question-
    During corrections we get corrections as a-b-c-X-a-b-c ) Now after the last c wave do we start wave 1 ?
    b) is it possible we form another set of X-a-b-c ? if yes how do we identify that the next upmove is an X wave or wave 1 ?
    c) How far would the X or wave 1 retrace upto ?
    This is something I did not find in the book.
    Thanks
    Gaurav

    Reply
    • Ramki on January 8, 2012 1:59 am

      HI Gaurav, (a) Corrections correct a prior impulse wave. So if your correction is wave 4, the next move will be wave 5 (and of course that itself will be made up of 5 sub waves) (b) Yes, with a complex correction we could have a triple zigzag, but there is no way knowing in advance whether we will get such a formation (c)There is no pre-set limit of how far an X wave can retrace. Thus, you have to wait for a mini 5 wave recovery after a complex correction and then buy the next dip with suitable stops.

      Reply
  14. Gaurav on January 8, 2012 9:47 pm

    Sir,
    You had promised us a nifty chart last week !
    pleasseeee 🙂
    Gaurav

    Reply
  15. Dr Sanjay Pote on January 13, 2012 9:21 am

    Sir, are you still holding the analysis for the Nifty mentioned in your last post since it
    has broken the triangle on the upside and made a new high today. Pl give your valuable
    advice.
    Thanks
    Dr Sanjay Pote

    Reply
  16. riddhi on January 17, 2012 4:36 am

    Sir what’s current view for L&T as its trading around 1270 I.e. Well above your tgt 1190.

    Reply
    • Ramki on January 17, 2012 6:29 am

      Hello Riddi, my target and plan was to BUY the stock if it dipped to 835, which it did not. The 1190 was a suggestion that if you were already having any stale longs, you might consider getting out of that. Given the speed of the recovery, one should have reconsidered that idea. Please bear in mind that Elliott Wave analysis is a guiding principle, and while it works very well when it does, you also need to constantly adjust to market developments.My L&T comment was written on 18 December, and we cannot hang on to it after a month while the markets have taken a new direction in teh meantime.

      Reply
  17. avinash more on January 25, 2012 1:09 am

    hello Sir , i really like your comments and views on various stocks . i would like to go through the concept of Elliot wave . How could i get your book in india?

    Reply
    • Ramki on January 25, 2012 3:54 am

      Hi Avinash, Thanks for the comments. You can only buy a digital edition of the book, either from Amazon or from Infibeam in India. Click on the image of the book on the right and read the instructions there. Enjoy.

      Reply

Leave A Reply Cancel Reply

Recent Posts
  • Has Meta (Facebook) stock seen the bottom
  • What Is The Nearest Technical Support For Meta (NASDAQ: FB)
  • Using Elliott Waves to Capture a Trade in S&P500
  • Hedge Funds and Elliott Waves – Netflix $NFLX
  • When Elliott Waves applauds the promoter’s signals!

WaveTimes is a Research Organization dedicated to providing original analysis, reports, reviews, and insights on developments in mutual funds, stocks, investing, foreign exchange, commodities, and bonds.

Contact WaveTimes

L-601 Mantri Espana,

Kariyammana Agrahara, Bellandur, Bangalore 560103

Follow Us

  • Facebook
  • YouTube
  • Twitter

© 2023 Wave Times. All Rights Reserved.
  • About
  • Books
  • Privacy Policy
  • Policies and Standards

Type above and press Enter to search. Press Esc to cancel.