• About
  • Elliott Waves
    • Elliott Waves Explained
    • Elliott Wave Magic Illustrated with Wave Charts
    • Elliott Wave Edge – How Elliott Wave Traders Win
    • Fibonacci Number Series and Elliott Waves
    • How to use Fibonacci Ratio Retracements
    • Elliott Wave Books
      • The Elliott Wave Book – Five Waves to Financial Freedom
      • Dividend Growth Investing Using Elliott Waves
    • Videos
  • Equities
    • Indices
      • Africa
        • Egypt
      • Australia
      • European Indices
        • AEX – Index, Amsterdam
        • DAX Index
        • Istanbul
        • Russia
        • Spain’s IBEX 35
      • Asian Indices
        • India
        • China
        • Dubai
        • Kuwait
        • Kuala Lumpur
        • Pakistan
        • Saudi
        • Taiwan
      • US Indices
        • S&P500
        • Nasdaq
        • Dow Jones
        • Dow Jones Utilities
    • Stocks
      • Asian Stocks
        • Indian Stocks Trading
        • Dubai Stocks Outlook
        • Japanese Stocks
        • Kuwait stocks
        • Saudi Stocks Outlook
      • African Stocks
        • Egyptian Stocks
      • Swiss Stocks
      • Australian Stocks
      • European Stocks
      • US Stocks outlook
      • UK Stocks
  • Commodities
    • Copper
    • Gasoline
    • Gold
    • Natural Gas
    • Oil
    • Palm Oil
    • Raw Sugar
    • Rubber
    • Soybean Oil
    • Silver
  • Forex
    • AUD
    • Bitcoin
    • CAD
    • CHF
    • Euro
    • GBP
    • INR
    • NZD
    • JPY
  • Raves
  • Consulting
    • Consulting
  • Ramki’s Watchlist
Top News

Has Meta (Facebook) stock seen the bottom

March 21, 2022

What Is The Nearest Technical Support For Meta (NASDAQ: FB)

February 7, 2022

Using Elliott Waves to Capture a Trade in S&P500

January 27, 2022
Facebook Twitter Instagram
WaveTimes Blog WaveTimes Blog
Wave times
  • About
  • Elliott Waves
    • Elliott Waves Explained
    • Elliott Wave Magic Illustrated with Wave Charts
    • Elliott Wave Edge – How Elliott Wave Traders Win
    • Fibonacci Number Series and Elliott Waves
    • How to use Fibonacci Ratio Retracements
    • Elliott Wave Books
      • The Elliott Wave Book – Five Waves to Financial Freedom
      • Dividend Growth Investing Using Elliott Waves
    • Videos
  • Equities
    • Indices
      • Africa
        • Egypt
      • Australia
      • European Indices
        • AEX – Index, Amsterdam
        • DAX Index
        • Istanbul
        • Russia
        • Spain’s IBEX 35
      • Asian Indices
        • India
        • China
        • Dubai
        • Kuwait
        • Kuala Lumpur
        • Pakistan
        • Saudi
        • Taiwan
      • US Indices
        • S&P500
        • Nasdaq
        • Dow Jones
        • Dow Jones Utilities
    • Stocks
      • Asian Stocks
        • Indian Stocks Trading
        • Dubai Stocks Outlook
        • Japanese Stocks
        • Kuwait stocks
        • Saudi Stocks Outlook
      • African Stocks
        • Egyptian Stocks
      • Swiss Stocks
      • Australian Stocks
      • European Stocks
      • US Stocks outlook
      • UK Stocks
  • Commodities
    • Copper
    • Gasoline
    • Gold
    • Natural Gas
    • Oil
    • Palm Oil
    • Raw Sugar
    • Rubber
    • Soybean Oil
    • Silver
  • Forex
    • AUD
    • Bitcoin
    • CAD
    • CHF
    • Euro
    • GBP
    • INR
    • NZD
    • JPY
  • Raves
  • Consulting
    • Consulting
  • Ramki’s Watchlist
WaveTimes Blog WaveTimes Blog
Home » Dow 30 – Alexander and Baldwin Inc
US Stocks outlook

Dow 30 – Alexander and Baldwin Inc

RamkiBy RamkiJuly 4, 20115 Comments2 Mins Read
Facebook Twitter LinkedIn Telegram Pinterest Tumblr Reddit WhatsApp Email
Share
Facebook Twitter LinkedIn Pinterest Email
Dow 30 stock - Top Mover : Alexander and Baldwin Inc

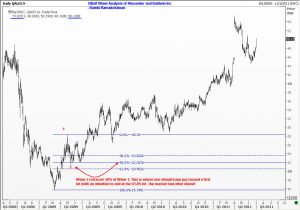
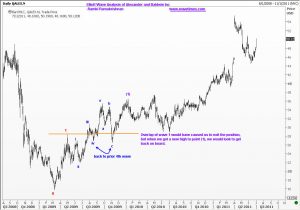
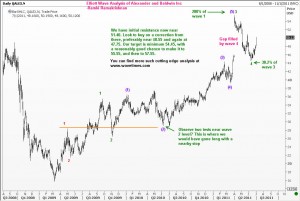
Dow 30 top mover Alexander and Baldwin Inc- chart 2Dow 30 top mover Alexander and Baldwin Inc -chart 3I believe that many of you are interested in individual stocks in the US markets.  Going forward, I will try and post my analysis of some of the Dow Jones Industrial Average or Dow 30 top movers. It could be a stock that moved up, or moved down aggressively. The idea is not only to give you a handle on how a technical trader will use Elliott Wave Analysis to trade the Dow 30 stock, but also to let you know what I think is the likely target in the near term.

The first stock we will look at is Alexander and Baldwin Inc, a stock that went up by a dollar and ninety six  or 4.07% on 1st July. This stock was the top mover last Friday among the stocks that make up the Dow Jones Composite Average. (I know I said Dow 30 , but too late, I spent too much time on this stock already, so we will leave it as it is :)-

The chart of Alexander and Baldwin Inc clearly shows an extending third wave. Thus, from an Elliott Wave perspective, we should continue to trade this stock from the long side, and look for it to eventually reach $55.50 or higher.

Feel free to comment on this analysis, and to share with your friends. The links to share are just below this line!

DJIA Dow Jones Dow30
Share. Facebook Twitter Pinterest LinkedIn Tumblr Telegram Email
Previous ArticleEUR/USD Chart Analysis
Next Article India's NSEI outlook
Ramki
  • Website

Related Posts

Has Meta (Facebook) stock seen the bottom

March 21, 2022

What Is The Nearest Technical Support For Meta (NASDAQ: FB)

February 7, 2022

Hedge Funds and Elliott Waves – Netflix $NFLX

January 17, 2022
View 5 Comments

5 Comments

  1. Majed on July 4, 2011 9:01 am

    Thank you
    I read your writings and analysis
    I really learn you every day
    Saudi Arabia

    Reply
    • Ramki on July 4, 2011 1:24 pm

      Hi Majed, thank you for taking time to write. Good luck!

      Reply
  2. K P Ganesh on July 4, 2011 9:17 am

    Wave 4 has re-traced in 5 waves. Does that mean the correction in Wave 4 isn’t fully complete, forming a more complex Wave 4 correction.

    Reply
    • Ramki on July 4, 2011 1:32 pm

      Hi Ganesh, that particular wave was a challenge for me too. I’m trying to think of it as a double zigzag, and honestly, one should not be ‘trying’ to fit a move to suit his count. Let us see.

      Reply
  3. Linda on July 6, 2011 6:55 pm

    Though I don’t trade stocks, but I like to see your charts. I am browsing your blog like everyday. Thank you Ramki!

    Reply

Leave A Reply Cancel Reply

Recent Posts
  • Has Meta (Facebook) stock seen the bottom
  • What Is The Nearest Technical Support For Meta (NASDAQ: FB)
  • Using Elliott Waves to Capture a Trade in S&P500
  • Hedge Funds and Elliott Waves – Netflix $NFLX
  • When Elliott Waves applauds the promoter’s signals!

WaveTimes is a Research Organization dedicated to providing original analysis, reports, reviews, and insights on developments in mutual funds, stocks, investing, foreign exchange, commodities, and bonds.

Contact WaveTimes

L-601 Mantri Espana,

Kariyammana Agrahara, Bellandur, Bangalore 560103

Follow Us

  • Facebook
  • YouTube
  • Twitter

© 2023 Wave Times. All Rights Reserved.
  • About
  • Books
  • Privacy Policy
  • Policies and Standards

Type above and press Enter to search. Press Esc to cancel.