• About
  • Elliott Waves
    • Elliott Waves Explained
    • Elliott Wave Magic Illustrated with Wave Charts
    • Elliott Wave Edge – How Elliott Wave Traders Win
    • Fibonacci Number Series and Elliott Waves
    • How to use Fibonacci Ratio Retracements
    • Elliott Wave Books
      • The Elliott Wave Book – Five Waves to Financial Freedom
      • Dividend Growth Investing Using Elliott Waves
    • Videos
  • Equities
    • Indices
      • Africa
        • Egypt
      • Australia
      • European Indices
        • AEX – Index, Amsterdam
        • DAX Index
        • Istanbul
        • Russia
        • Spain’s IBEX 35
      • Asian Indices
        • India
        • China
        • Dubai
        • Kuwait
        • Kuala Lumpur
        • Pakistan
        • Saudi
        • Taiwan
      • US Indices
        • S&P500
        • Nasdaq
        • Dow Jones
        • Dow Jones Utilities
    • Stocks
      • Asian Stocks
        • Indian Stocks Trading
        • Dubai Stocks Outlook
        • Japanese Stocks
        • Kuwait stocks
        • Saudi Stocks Outlook
      • African Stocks
        • Egyptian Stocks
      • Swiss Stocks
      • Australian Stocks
      • European Stocks
      • US Stocks outlook
      • UK Stocks
  • Commodities
    • Copper
    • Gasoline
    • Gold
    • Natural Gas
    • Oil
    • Palm Oil
    • Raw Sugar
    • Rubber
    • Soybean Oil
    • Silver
  • Forex
    • AUD
    • Bitcoin
    • CAD
    • CHF
    • Euro
    • GBP
    • INR
    • NZD
    • JPY
  • Raves
  • Consulting
    • Consulting
  • Ramki’s Watchlist
Top News

Has Meta (Facebook) stock seen the bottom

March 21, 2022

What Is The Nearest Technical Support For Meta (NASDAQ: FB)

February 7, 2022

Using Elliott Waves to Capture a Trade in S&P500

January 27, 2022
Facebook Twitter Instagram
WaveTimes Blog WaveTimes Blog
Wave times
  • About
  • Elliott Waves
    • Elliott Waves Explained
    • Elliott Wave Magic Illustrated with Wave Charts
    • Elliott Wave Edge – How Elliott Wave Traders Win
    • Fibonacci Number Series and Elliott Waves
    • How to use Fibonacci Ratio Retracements
    • Elliott Wave Books
      • The Elliott Wave Book – Five Waves to Financial Freedom
      • Dividend Growth Investing Using Elliott Waves
    • Videos
  • Equities
    • Indices
      • Africa
        • Egypt
      • Australia
      • European Indices
        • AEX – Index, Amsterdam
        • DAX Index
        • Istanbul
        • Russia
        • Spain’s IBEX 35
      • Asian Indices
        • India
        • China
        • Dubai
        • Kuwait
        • Kuala Lumpur
        • Pakistan
        • Saudi
        • Taiwan
      • US Indices
        • S&P500
        • Nasdaq
        • Dow Jones
        • Dow Jones Utilities
    • Stocks
      • Asian Stocks
        • Indian Stocks Trading
        • Dubai Stocks Outlook
        • Japanese Stocks
        • Kuwait stocks
        • Saudi Stocks Outlook
      • African Stocks
        • Egyptian Stocks
      • Swiss Stocks
      • Australian Stocks
      • European Stocks
      • US Stocks outlook
      • UK Stocks
  • Commodities
    • Copper
    • Gasoline
    • Gold
    • Natural Gas
    • Oil
    • Palm Oil
    • Raw Sugar
    • Rubber
    • Soybean Oil
    • Silver
  • Forex
    • AUD
    • Bitcoin
    • CAD
    • CHF
    • Euro
    • GBP
    • INR
    • NZD
    • JPY
  • Raves
  • Consulting
    • Consulting
  • Ramki’s Watchlist
WaveTimes Blog WaveTimes Blog
Home » Crude Oil Outlook
Oil

Crude Oil Outlook

RamkiBy RamkiMay 26, 20115 Comments2 Mins Read
Facebook Twitter LinkedIn Telegram Pinterest Tumblr Reddit WhatsApp Email
Share
Facebook Twitter LinkedIn Pinterest Email

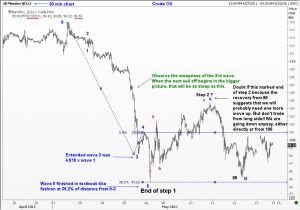
On 15th May, I prepared the first chart for a friend of mine in the Far East. The important point to note is this was done before Goldman Sachs came out with a bullish call on Oil. The set-up was right, and the moment that news hit the market, prices started going up. This is the way things usually work. There will be a catalyst, and the move will materialize! However, once the catalyst wears off, or as fresh news comes to the fore, the old fundamentals will reassert themselves. The only tool we have is Elliott Wave Principle. Our count says Oil will go lower, once this correction is finished. We should stick with the original view until the count is proved wrong (by the violation of one or more rules of the Wave Principle, or by some guideline going out of sync with the developing patterns).
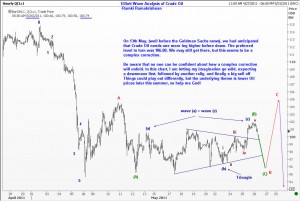
I have said that we are in a correction. As you can see from the scond chart, this correction is turning out to be a complex one, ie one where there are combinations of smaller patterns. Complex corrections are notoriously unpredictable because they take all shapes and travel distances that we cant anticipate. Yet, I have given one possible version here. What is more important for most traders is the bigger direction, Is it down, or is it up? I still think we go lower. Let us see.

Share. Facebook Twitter Pinterest LinkedIn Tumblr Telegram Email
Previous ArticleCommodities call
Next Article Elliott Wave Analysis of EUR/USD
Ramki
  • Website

Related Posts

Crude Oil & Brent Crude Outlook: Can I get more wrong than this?

July 1, 2012

Elliott Wave Outlook for Brent Crude

June 26, 2012

Crude Oil Still Has Another 10% Price Drop In The Well

June 25, 2012
View 5 Comments

5 Comments

  1. Manoj Kumar on May 26, 2011 7:52 am

    Sir If I Start Selling Crude–Gold, as a medium term position, What Can Be Stoploss — Sir Ur Views Are Excellent Hats Off Those Who Are Ur Viewers I Dam Sure Will Learn Many Things From ur Blog
    Regards
    Manoj Kumar

    Reply
  2. Bob D on May 27, 2011 7:46 am

    Dear Ramki: Thank you very much for the postings of May 8th, 9th, 12th and 16th. Each posting is a roadmap for a particular asset, but when viewed together gives not only great ideas for trading, but an indication of the future for numerous economies. The Chinese proverb comes to mind…”may you live in exciting times”

    Reply
  3. Ziad on May 29, 2011 2:24 pm

    Dear Manoj Kumar

    Iwould like to add some more on your comment above for all the viewers of this blog is that will not only Learn Many Things but they will love the way Mr.Ramki analysis the markets….Trust me we know him for over 25 years by now,anyways time will tell and then you can judge by your self….

    Keep It Up Ramki…..GoodLuck To All

    Cheers
    Ziad

    Reply
    • Ramki on May 30, 2011 5:26 am

      Ziad, and all other friends, Thanks so much. I am only publishing some of these compliments because you took the time to write. If you gained something from these works, that itself makes me happy. Once again, thank you.

      Reply
  4. Bob Dreslinski on June 21, 2011 2:00 am

    Dear Ramki,

    On May 26th, you illustrated Crude Oil and prepared us to think about the next decline and what it might look like. Also you mentioned the Goldman Sach’s call on Oil and explained how even some of the best analyst can make mistakes. Your direction on Oil has proven extremely accurate and I now ponder the shape and amplitude of the next decline in Oil.

    On May 26th Oil closed at $101.32 (the date of your post) and is now below what appears to be the extreme of wave 1 at $94.62. With the decline below the low of wave 1 I suspect wave 3 is now in the making. In your 30 minute chart you pointed to the “steepness” of wave 3, within wave 1 and suggested that we should expect/anticipate a like steepness in the next wave down (likely wave 3) once wave 2 is complete. With the decline now below $94.62, should we anticipate an acceleration to the downside, or is wave 2 not yet complete?

    Thank you for reading my question.

    Good fortune,
    Bob

    Reply

Leave A Reply Cancel Reply

Recent Posts
  • Has Meta (Facebook) stock seen the bottom
  • What Is The Nearest Technical Support For Meta (NASDAQ: FB)
  • Using Elliott Waves to Capture a Trade in S&P500
  • Hedge Funds and Elliott Waves – Netflix $NFLX
  • When Elliott Waves applauds the promoter’s signals!

WaveTimes is a Research Organization dedicated to providing original analysis, reports, reviews, and insights on developments in mutual funds, stocks, investing, foreign exchange, commodities, and bonds.

Contact WaveTimes

L-601 Mantri Espana,

Kariyammana Agrahara, Bellandur, Bangalore 560103

Follow Us

  • Facebook
  • YouTube
  • Twitter

© 2023 Wave Times. All Rights Reserved.
  • About
  • Books
  • Privacy Policy
  • Policies and Standards

Type above and press Enter to search. Press Esc to cancel.