• About
  • Elliott Waves
    • Elliott Waves Explained
    • Elliott Wave Magic Illustrated with Wave Charts
    • Elliott Wave Edge – How Elliott Wave Traders Win
    • Fibonacci Number Series and Elliott Waves
    • How to use Fibonacci Ratio Retracements
    • Elliott Wave Books
      • The Elliott Wave Book – Five Waves to Financial Freedom
      • Dividend Growth Investing Using Elliott Waves
    • Videos
  • Equities
    • Indices
      • Africa
        • Egypt
      • Australia
      • European Indices
        • AEX – Index, Amsterdam
        • DAX Index
        • Istanbul
        • Russia
        • Spain’s IBEX 35
      • Asian Indices
        • India
        • China
        • Dubai
        • Kuwait
        • Kuala Lumpur
        • Pakistan
        • Saudi
        • Taiwan
      • US Indices
        • S&P500
        • Nasdaq
        • Dow Jones
        • Dow Jones Utilities
    • Stocks
      • Asian Stocks
        • Indian Stocks Trading
        • Dubai Stocks Outlook
        • Japanese Stocks
        • Kuwait stocks
        • Saudi Stocks Outlook
      • African Stocks
        • Egyptian Stocks
      • Swiss Stocks
      • Australian Stocks
      • European Stocks
      • US Stocks outlook
      • UK Stocks
  • Commodities
    • Copper
    • Gasoline
    • Gold
    • Natural Gas
    • Oil
    • Palm Oil
    • Raw Sugar
    • Rubber
    • Soybean Oil
    • Silver
  • Forex
    • AUD
    • Bitcoin
    • CAD
    • CHF
    • Euro
    • GBP
    • INR
    • NZD
    • JPY
  • Raves
  • Consulting
    • Consulting
  • Ramki’s Watchlist
Top News

Has Meta (Facebook) stock seen the bottom

March 21, 2022

What Is The Nearest Technical Support For Meta (NASDAQ: FB)

February 7, 2022

Using Elliott Waves to Capture a Trade in S&P500

January 27, 2022
Facebook Twitter Instagram
WaveTimes Blog WaveTimes Blog
Wave times
  • About
  • Elliott Waves
    • Elliott Waves Explained
    • Elliott Wave Magic Illustrated with Wave Charts
    • Elliott Wave Edge – How Elliott Wave Traders Win
    • Fibonacci Number Series and Elliott Waves
    • How to use Fibonacci Ratio Retracements
    • Elliott Wave Books
      • The Elliott Wave Book – Five Waves to Financial Freedom
      • Dividend Growth Investing Using Elliott Waves
    • Videos
  • Equities
    • Indices
      • Africa
        • Egypt
      • Australia
      • European Indices
        • AEX – Index, Amsterdam
        • DAX Index
        • Istanbul
        • Russia
        • Spain’s IBEX 35
      • Asian Indices
        • India
        • China
        • Dubai
        • Kuwait
        • Kuala Lumpur
        • Pakistan
        • Saudi
        • Taiwan
      • US Indices
        • S&P500
        • Nasdaq
        • Dow Jones
        • Dow Jones Utilities
    • Stocks
      • Asian Stocks
        • Indian Stocks Trading
        • Dubai Stocks Outlook
        • Japanese Stocks
        • Kuwait stocks
        • Saudi Stocks Outlook
      • African Stocks
        • Egyptian Stocks
      • Swiss Stocks
      • Australian Stocks
      • European Stocks
      • US Stocks outlook
      • UK Stocks
  • Commodities
    • Copper
    • Gasoline
    • Gold
    • Natural Gas
    • Oil
    • Palm Oil
    • Raw Sugar
    • Rubber
    • Soybean Oil
    • Silver
  • Forex
    • AUD
    • Bitcoin
    • CAD
    • CHF
    • Euro
    • GBP
    • INR
    • NZD
    • JPY
  • Raves
  • Consulting
    • Consulting
  • Ramki’s Watchlist
WaveTimes Blog WaveTimes Blog
Home » Crude Oil & Brent Crude Outlook: Can I get more wrong than this?
Oil

Crude Oil & Brent Crude Outlook: Can I get more wrong than this?

RamkiBy RamkiJuly 1, 201217 Comments1 Min Read
Facebook Twitter LinkedIn Telegram Pinterest Tumblr Reddit WhatsApp Email
Share
Facebook Twitter LinkedIn Pinterest Email

On 25 June 2012, when Crude Oil was trading around $79, I wrote on Forbes that Crude oil still has another 10% downside. And on the next day, when Brent Crude was near $92, I said the same thing – that it has another 10% to go – on the DOWNSIDE, that is. Guess what! Crude went from $77.28 to $85.34, a move of 10% UP, and Brent Crude went from $91.73 to $98.28 all in one day.Wow! What happened there?
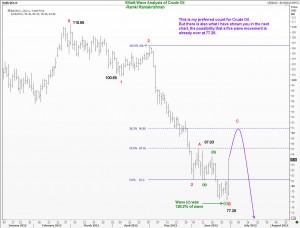
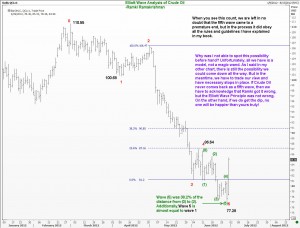
Now I do have a track record of occasionally getting things really wrong, but this takes the crown. Or does it? Should we write off the bears? Suppose I say that we will still see Crude down to near the targets mentioned earlier, I will be unnecessarily shooting myself in the foot. But just as I gave you technical reasons for my earlier calls, I wish to give you a couple of charts and you can make up your own mind.

crude oil
Share. Facebook Twitter Pinterest LinkedIn Tumblr Telegram Email
Previous ArticleElliott Wave Analysis of Taiwan's TAIEX Index (TWSE)
Next Article Elliott Wave Analysis of USD/INR (Indian Rupee)
Ramki
  • Website

Related Posts

Elliott Wave Outlook for Brent Crude

June 26, 2012

Crude Oil Still Has Another 10% Price Drop In The Well

June 25, 2012

Elliott Wave update on Crude Oil 12 Dec 2011

December 12, 2011
View 17 Comments

17 Comments

  1. Ram on July 1, 2012 6:56 am

    Ramki,

    Excellent one. I think it has more downside than upside in the near term. No one thought S&P would rally 2.5% in one day.

    Reply
  2. JG on July 1, 2012 1:25 pm

    Dear Ramki
    I have much enjoyed reading all your articles over the past few months, especially the post on Glencore. I would be very grateful if you could update your 2010 post on Barclays. with best wishes.

    Reply
  3. newbie on July 2, 2012 6:47 pm

    Thanks for the update,

    Curious if the time on the chart implies a top during the second week of July? (Are the charts indicative of time)

    thx

    Reply
    • Ramki on July 2, 2012 8:37 pm

      Newbie, no. My analysis does not incorporate time.

      Reply
  4. chauhan mufazal on July 2, 2012 11:07 pm

    wishing u a happy guru purnima,
    Pls accept my gratitude and respectful pranam for guiding me for financial freedom,
    and i am feeling of proud for my self
    for the same counting as per your second chart,
    thanks for chart,

    Reply
  5. nandan on July 6, 2012 9:41 pm

    according to daily chart. i think we had extended wave 3 in crude oil which more than 260 percent of wave 2. As per my Elliott wave count 4th wave should stay below 4919(62 percent of wave 3- fibo level) to have strong wave 5 downside. profit taking index is healthy oscillator has pulled back to zero @ 4867 which means 4 wave is over and we are in a downtrend. To complete the wave count oil should least take off wave 3 low.

    Ramki i dont think second possibility that you have proposed full fills Elliott principle because wave 4 should at least re tress 38 percent of wave 3 to form wave 4 which has not happened so i feel its just the extended wave 3.
    cheers!

    Reply
    • Ramki Ramakrishnan on July 8, 2012 10:14 pm

      Nandan, Thank you for your comments. I think you are discussing the price of crude oil in terms of the Indian Rupee, whereas my analysis is based on the price in USD. Please bear in mind that the INR also moves and the market for trades expressed in that currency will respond to emotions caused by movement in INR. Also, your understanding of what EWP says about wave 4 is different from mine. Good luck.

      Reply
      • nandan on July 10, 2012 11:45 pm

        yaa… you are right… thank you for the reply. 🙂

        Reply
      • CHAUHAN on August 21, 2012 6:14 am

        mcx crude is follow international usd prise rupee by rupee,as per my experience,
        ramkisir their is repeated abc ABC forming in crude c is near to end. looking at charts if time permit, your wave counts very much needed,

        Reply
  6. Rahul on July 18, 2012 11:11 pm

    Hello Ramki,

    Can we take a low risk short entry int crude now at around 90.50. What should be the sl for this trade. Also would like to know we are going with the second chart what should be the next count. Will it be a ABC rise .

    Rgds
    Rahul

    Reply
    • Ramki Ramakrishnan on July 19, 2012 2:09 am

      Hi Rahul, Thanks for writing. In its present avatar, WateTimes is not offering any trading advice. Best wishes

      Reply
  7. SONI HITESHKUMAR MAHESHCHANDRA on July 19, 2012 9:44 pm

    Respected Sir,

    Crude oil trade @ 92.20$ & high of yesterday is 92.93$, crude oil has already retrecement @ 38.2 % of 0-3 wave & (c) wave has taken 261.8% of wave (a) after irregular (b) wave. so now i feel that the 5th wave will start now. Is it right ? pl. guide me.

    Reply
    • Ramki Ramakrishnan on July 21, 2012 1:44 am

      Hi Soni, I must apologize but wavetimes doesn’t offer such trading advice, best wishes

      Reply
  8. Karan Chetan on August 1, 2012 1:08 am

    Hi Ramki,

    We have seen Crude oil make a high of around $93 in July. Is your preferred count still the first scenario (which means we are seeing wave 5) or is it likely that the 5 waves completed at around $78, since the retracement from $78 to $93 was more than 38.2%?

    Reply
    • Ramki Ramakrishnan on August 2, 2012 2:14 am

      Karan, We have trhe ECB decision today and the markets could do something weird. But on balance I still favor the first scenario of Crude coming off.

      Reply
      • Karan Chetan on August 30, 2012 3:08 am

        Hi Ramki,

        Thanks for the reply. I can’t help but point out that WTI crude has made an exact 61.8% retracement of the decline from ~$110 to ~$77. As per my wave count, we are seeing a five wave downmove from 98.29. (I Still don’t know if this is the 5th wave down or we have begun a new cycle).

        I have a question about an extended 5th wave. As per your book, the most likely length of the 5th wave will be the distance from 0 to 3. But, does that 5th wave also need to be greater than 161.8% of wave 1 or wave 3? (assuming wave 1 = wave 3)

        Regards,

        Karan

        Reply
        • Ramki Ramakrishnan on August 30, 2012 4:29 am

          Hi Karan, the notes about extensions are only guidelines. There are no limits to an extension. If an impulse wave is greater than 161.8% of any other impulse wave, I would consider that as an extending wave.

          Reply

Leave A Reply Cancel Reply

Recent Posts
  • Has Meta (Facebook) stock seen the bottom
  • What Is The Nearest Technical Support For Meta (NASDAQ: FB)
  • Using Elliott Waves to Capture a Trade in S&P500
  • Hedge Funds and Elliott Waves – Netflix $NFLX
  • When Elliott Waves applauds the promoter’s signals!

WaveTimes is a Research Organization dedicated to providing original analysis, reports, reviews, and insights on developments in mutual funds, stocks, investing, foreign exchange, commodities, and bonds.

Contact WaveTimes

L-601 Mantri Espana,

Kariyammana Agrahara, Bellandur, Bangalore 560103

Follow Us

  • Facebook
  • YouTube
  • Twitter

© 2023 Wave Times. All Rights Reserved.
  • About
  • Books
  • Privacy Policy
  • Policies and Standards

Type above and press Enter to search. Press Esc to cancel.