• About
  • Elliott Waves
    • Elliott Waves Explained
    • Elliott Wave Magic Illustrated with Wave Charts
    • Elliott Wave Edge – How Elliott Wave Traders Win
    • Fibonacci Number Series and Elliott Waves
    • How to use Fibonacci Ratio Retracements
    • Elliott Wave Books
      • The Elliott Wave Book – Five Waves to Financial Freedom
      • Dividend Growth Investing Using Elliott Waves
    • Videos
  • Equities
    • Indices
      • Africa
        • Egypt
      • Australia
      • European Indices
        • AEX – Index, Amsterdam
        • DAX Index
        • Istanbul
        • Russia
        • Spain’s IBEX 35
      • Asian Indices
        • India
        • China
        • Dubai
        • Kuwait
        • Kuala Lumpur
        • Pakistan
        • Saudi
        • Taiwan
      • US Indices
        • S&P500
        • Nasdaq
        • Dow Jones
        • Dow Jones Utilities
    • Stocks
      • Asian Stocks
        • Indian Stocks Trading
        • Dubai Stocks Outlook
        • Japanese Stocks
        • Kuwait stocks
        • Saudi Stocks Outlook
      • African Stocks
        • Egyptian Stocks
      • Swiss Stocks
      • Australian Stocks
      • European Stocks
      • US Stocks outlook
      • UK Stocks
  • Commodities
    • Copper
    • Gasoline
    • Gold
    • Natural Gas
    • Oil
    • Palm Oil
    • Raw Sugar
    • Rubber
    • Soybean Oil
    • Silver
  • Forex
    • AUD
    • Bitcoin
    • CAD
    • CHF
    • Euro
    • GBP
    • INR
    • NZD
    • JPY
  • Raves
  • Consulting
    • Consulting
  • Ramki’s Watchlist
Top News

Has Meta (Facebook) stock seen the bottom

March 21, 2022

What Is The Nearest Technical Support For Meta (NASDAQ: FB)

February 7, 2022

Using Elliott Waves to Capture a Trade in S&P500

January 27, 2022
Facebook Twitter Instagram
WaveTimes Blog WaveTimes Blog
Wave times
  • About
  • Elliott Waves
    • Elliott Waves Explained
    • Elliott Wave Magic Illustrated with Wave Charts
    • Elliott Wave Edge – How Elliott Wave Traders Win
    • Fibonacci Number Series and Elliott Waves
    • How to use Fibonacci Ratio Retracements
    • Elliott Wave Books
      • The Elliott Wave Book – Five Waves to Financial Freedom
      • Dividend Growth Investing Using Elliott Waves
    • Videos
  • Equities
    • Indices
      • Africa
        • Egypt
      • Australia
      • European Indices
        • AEX – Index, Amsterdam
        • DAX Index
        • Istanbul
        • Russia
        • Spain’s IBEX 35
      • Asian Indices
        • India
        • China
        • Dubai
        • Kuwait
        • Kuala Lumpur
        • Pakistan
        • Saudi
        • Taiwan
      • US Indices
        • S&P500
        • Nasdaq
        • Dow Jones
        • Dow Jones Utilities
    • Stocks
      • Asian Stocks
        • Indian Stocks Trading
        • Dubai Stocks Outlook
        • Japanese Stocks
        • Kuwait stocks
        • Saudi Stocks Outlook
      • African Stocks
        • Egyptian Stocks
      • Swiss Stocks
      • Australian Stocks
      • European Stocks
      • US Stocks outlook
      • UK Stocks
  • Commodities
    • Copper
    • Gasoline
    • Gold
    • Natural Gas
    • Oil
    • Palm Oil
    • Raw Sugar
    • Rubber
    • Soybean Oil
    • Silver
  • Forex
    • AUD
    • Bitcoin
    • CAD
    • CHF
    • Euro
    • GBP
    • INR
    • NZD
    • JPY
  • Raves
  • Consulting
    • Consulting
  • Ramki’s Watchlist
WaveTimes Blog WaveTimes Blog
Home » Copper: Edging closer to top.
Copper

Copper: Edging closer to top.

RamkiBy RamkiDecember 10, 201024 Comments2 Mins Read
Facebook Twitter LinkedIn Telegram Pinterest Tumblr Reddit WhatsApp Email
Share
Facebook Twitter LinkedIn Pinterest Email

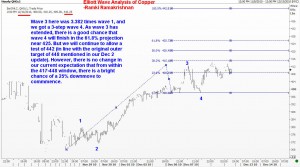
On 2nd December I pointed out that we are in the 5th of the Fifth wave in Copper and that we are likley to see the peak between 417 and 448. There is no change in that outlook for Copper. (On 8th December I posted a short-term chart from a different provider showing a 5-wave decline. Unfortunately, I have a feeling that there might be something wrong in that chart, because today’s image shows a 3-wave decline, which explains why we went up again to a new high). Anyway, in the big picture, we are still calling a top in the window mentioned above.

Copper has been strong because of demand from China. Lack of action on the interest rate front from China was also supporting copper prices, just as Gold hit a new record level. Many analysts are citing anticipated supply deficits next year as a reason why copper should remain firm. HOwever, be aware that the markets tend to discount such news and maybe all this is getting reflected in current prices. We shall see soon enough.

By the way, I have put back the links for free subscription by email and RSS reader at the top of this page. You may wish to alert your friends about this. Best wishes. Ramki

copper outlook outlook on copper
Share. Facebook Twitter Pinterest LinkedIn Tumblr Telegram Email
Previous ArticleCopper: short term outlook
Next Article USD interest rate outlook 5 year dollar swap curve
Ramki
  • Website

Related Posts

Elliott Wave Analysis of CPER -ETF- United States Copper Index Fund

March 1, 2019

Special Update to my Elliott Wave Book

April 5, 2018

How Elliott Wave Analysis anticipated higher Copper prices

July 25, 2017
View 24 Comments

24 Comments

  1. luca on December 11, 2010 9:33 am

    Dear Sir,
    Merry Christmas and a Happy New Year
    “Buon Natale e felice anno nuovo”
    your work is appreciated by all of us
    cheers
    luca

    Reply
    • Ramki on December 11, 2010 10:07 am

      Luca, Thank you and wish you and your family the very best for the New Year. Merry Christmas. Ramki

      Reply
  2. Linda on December 12, 2010 10:26 am

    HI ramki

    merry xmas and a happy new year ahead for you.
    i was wondering if you could help chart USDSGD. the corrective rally of USD has been weak and if it is indeed the 4th of 5th wave. before the final 5th. could you advise the turning point for the 4th before the 5th starts.

    in addition, whilst im at the AUD category. do you forsee a correctivn to 93 before an assault of 1.05? or is 1.028 the top? the correction so far has yeild mixed results. down 5 and correct 5.

    thank you.

    Reply
    • Ramki on December 12, 2010 11:23 am

      Hi Linda, Thanks for your comment. Will try.. I already have a load of requests outstanding….

      Reply
  3. Yasharth Nathani on January 5, 2011 10:14 pm

    Hello sir,

    Any Updates on the copper.

    regards,

    Yasharth Nathani

    Reply
    • Ramki on January 6, 2011 5:30 am

      Yashrath, At present there is no change in view. We could still get the push to reach 448, but the recent sharp downmove is perhaps an early warning of potential risks to being long up here. I wouldnt sell until a top is confirmed. Identifying a top is one thing. To trade that requires a sell signal which is not seen yet.

      Reply
  4. keyur on January 6, 2011 9:09 am

    sir now top confirmed in copper????

    Reply
    • Ramki on January 6, 2011 11:48 am

      Keyur, No, we need some more clues before confirming the top

      Reply
  5. ajay on January 7, 2011 2:21 am

    dear sir can we confirm now the diagonal triangle on gold& silver has worked out and one more question i saw from elliotwave .com that “exponential trend line” of ten years in silver chart has hit it’s target at 31.24 so can we except for a huge correction from here?

    Reply
  6. Keyur on January 12, 2011 10:23 pm

    sir yesterday copper has made high of 443.90 so now is it confirmed that copper is topped out????

    Reply
  7. keyur on January 18, 2011 11:10 am

    Sir at today’s high of 447.80 can we say tht copper has completed its 5th wave?

    Reply
    • Ramki on January 18, 2011 11:45 am

      Hello Keyur, Re copper, we can only say that one of its 5th wave targets has been met. In order to turn short, we should wait for a 5-wave downmove to be completed (in the intraday charts) and then wait for a 50% pull back before selling. Even then, we should keep a protective stop above the high. There is no way to tell when an extension will finish. We can only project possible targets.

      Reply
  8. HEMIN on January 19, 2011 7:48 am

    Sir,

    in copper(or any chart) how we know(confirmation) 5-wave is completed which level

    should be break or any retracement level ? from wave -4 to wave-5

    Thanks

    Reply
    • Ramki on January 19, 2011 8:14 pm

      Hemin, One will have to look at the first reaction from the end of the move and make a judgement call is that new move is an impulse or a correction. Trading is thus a different ball game.

      Reply
  9. manoj on January 19, 2011 10:34 am

    ramki sir please project in chart if possible of copper update please sir

    Reply
  10. Keyur on January 20, 2011 9:59 pm

    sir copper has made the high of 448.75 n now trading at 434…. sir is it conformation tht 5 th wave is over?

    Reply
  11. Ramki on January 23, 2011 5:50 am

    Keyur, Manor, Hemin, and others.. No I dont think the 5th wave is over in Copper. We will probably stay above 416 and test higher one last time. It is too soon to get bearish, but be prepared for that topping out in the not distant future.

    Reply
  12. Keyur on January 27, 2011 10:22 pm

    sir any update on copper pls?

    Reply
    • Ramki on January 30, 2011 4:47 am

      HI Keyur, Looks like we need to spend some more time up here. Too soon to get bearish, even though we had a $20 drop in price.

      Reply
  13. Keyur on February 17, 2011 3:06 am

    hello sir,

    there was a good fall in copper in last two days. sir now can we tell that 5th wave is over?

    Reply
    • Ramki on February 20, 2011 10:25 pm

      Hi Keyur, No. I think it is still too soon to say that

      Reply
  14. Keyur on February 28, 2011 4:49 am

    sir nw any view on copper as it happened d same as u told .

    Reply
  15. Keyur on March 3, 2011 11:37 pm

    sir can u tell tht where we are as far as copper is concern pls? eagerly waiting for the reply.

    Reply
    • Ramki on March 6, 2011 4:01 am

      Hi Keyur, i think the picture remains bullinsh for the time being. So any dip to 425 to 420 area should be used to cover shorts and go long. The uptrend remains strong.

      Reply

Leave A Reply Cancel Reply

Recent Posts
  • Has Meta (Facebook) stock seen the bottom
  • What Is The Nearest Technical Support For Meta (NASDAQ: FB)
  • Using Elliott Waves to Capture a Trade in S&P500
  • Hedge Funds and Elliott Waves – Netflix $NFLX
  • When Elliott Waves applauds the promoter’s signals!

WaveTimes is a Research Organization dedicated to providing original analysis, reports, reviews, and insights on developments in mutual funds, stocks, investing, foreign exchange, commodities, and bonds.

Contact WaveTimes

L-601 Mantri Espana,

Kariyammana Agrahara, Bellandur, Bangalore 560103

Follow Us

  • Facebook
  • YouTube
  • Twitter

© 2023 Wave Times. All Rights Reserved.
  • About
  • Books
  • Privacy Policy
  • Policies and Standards

Type above and press Enter to search. Press Esc to cancel.