• About
  • Elliott Waves
    • Elliott Waves Explained
    • Elliott Wave Magic Illustrated with Wave Charts
    • Elliott Wave Edge – How Elliott Wave Traders Win
    • Fibonacci Number Series and Elliott Waves
    • How to use Fibonacci Ratio Retracements
    • Elliott Wave Books
      • The Elliott Wave Book – Five Waves to Financial Freedom
      • Dividend Growth Investing Using Elliott Waves
    • Videos
  • Equities
    • Indices
      • Africa
        • Egypt
      • Australia
      • European Indices
        • AEX – Index, Amsterdam
        • DAX Index
        • Istanbul
        • Russia
        • Spain’s IBEX 35
      • Asian Indices
        • India
        • China
        • Dubai
        • Kuwait
        • Kuala Lumpur
        • Pakistan
        • Saudi
        • Taiwan
      • US Indices
        • S&P500
        • Nasdaq
        • Dow Jones
        • Dow Jones Utilities
    • Stocks
      • Asian Stocks
        • Indian Stocks Trading
        • Dubai Stocks Outlook
        • Japanese Stocks
        • Kuwait stocks
        • Saudi Stocks Outlook
      • African Stocks
        • Egyptian Stocks
      • Swiss Stocks
      • Australian Stocks
      • European Stocks
      • US Stocks outlook
      • UK Stocks
  • Commodities
    • Copper
    • Gasoline
    • Gold
    • Natural Gas
    • Oil
    • Palm Oil
    • Raw Sugar
    • Rubber
    • Soybean Oil
    • Silver
  • Forex
    • AUD
    • Bitcoin
    • CAD
    • CHF
    • Euro
    • GBP
    • INR
    • NZD
    • JPY
  • Raves
  • Consulting
    • Consulting
  • Ramki’s Watchlist
Top News

Has Meta (Facebook) stock seen the bottom

March 21, 2022

What Is The Nearest Technical Support For Meta (NASDAQ: FB)

February 7, 2022

Using Elliott Waves to Capture a Trade in S&P500

January 27, 2022
Facebook Twitter Instagram
WaveTimes Blog WaveTimes Blog
Wave times
  • About
  • Elliott Waves
    • Elliott Waves Explained
    • Elliott Wave Magic Illustrated with Wave Charts
    • Elliott Wave Edge – How Elliott Wave Traders Win
    • Fibonacci Number Series and Elliott Waves
    • How to use Fibonacci Ratio Retracements
    • Elliott Wave Books
      • The Elliott Wave Book – Five Waves to Financial Freedom
      • Dividend Growth Investing Using Elliott Waves
    • Videos
  • Equities
    • Indices
      • Africa
        • Egypt
      • Australia
      • European Indices
        • AEX – Index, Amsterdam
        • DAX Index
        • Istanbul
        • Russia
        • Spain’s IBEX 35
      • Asian Indices
        • India
        • China
        • Dubai
        • Kuwait
        • Kuala Lumpur
        • Pakistan
        • Saudi
        • Taiwan
      • US Indices
        • S&P500
        • Nasdaq
        • Dow Jones
        • Dow Jones Utilities
    • Stocks
      • Asian Stocks
        • Indian Stocks Trading
        • Dubai Stocks Outlook
        • Japanese Stocks
        • Kuwait stocks
        • Saudi Stocks Outlook
      • African Stocks
        • Egyptian Stocks
      • Swiss Stocks
      • Australian Stocks
      • European Stocks
      • US Stocks outlook
      • UK Stocks
  • Commodities
    • Copper
    • Gasoline
    • Gold
    • Natural Gas
    • Oil
    • Palm Oil
    • Raw Sugar
    • Rubber
    • Soybean Oil
    • Silver
  • Forex
    • AUD
    • Bitcoin
    • CAD
    • CHF
    • Euro
    • GBP
    • INR
    • NZD
    • JPY
  • Raves
  • Consulting
    • Consulting
  • Ramki’s Watchlist
WaveTimes Blog WaveTimes Blog
Home » COMEX SILVER :Elliott Wave Analysis
Silver

COMEX SILVER :Elliott Wave Analysis

RamkiBy RamkiNovember 23, 201024 Comments1 Min Read
Facebook Twitter LinkedIn Telegram Pinterest Tumblr Reddit WhatsApp Email
Share
Facebook Twitter LinkedIn Pinterest Email

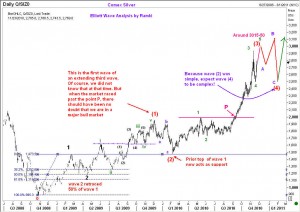
A reader requested for an analysis of Comex Silver, and I decided to take some time off to look that up. The chart is quite interesting. Maybe I should start writing more on commodities! Anyway, here goes. We should take a look above 3000 and then come down in a complex fourth wave. That part of the correction will prove very difficult for many traders, and I would help if I had the time! Unfortunately, I am still very busy in my present full time job…
So use the road map in the attached chart and stay lucky! Regards
Ramki

Share. Facebook Twitter Pinterest LinkedIn Tumblr Telegram Email
Previous ArticleHas India's NIFTY topped out?
Next Article Elliott Wave Analysis of Euro
Ramki
  • Website

Related Posts

A short-term trade in Silver using Elliott Waves

June 18, 2020

Elliott Wave Analysis of Silver – Multi Commodity Exchange of India

November 6, 2015

Monitoring a position after execution

October 19, 2012
View 24 Comments

24 Comments

  1. Kumar on December 2, 2010 4:40 am

    Hi sir,

    Thank u very much for your silver wave count….your analysis on silver is given moral support & inspired me to learn in depth of the wave theory…..once again thank u very much sir……

    regard’s
    Kumar.

    Reply
  2. ajay on December 13, 2010 9:26 pm

    dear sir, Can I ask you a question ?You have shown in the silver chart wave 1 high at 2000. and the low at 1700 as wave 2 coloured green. i can see there is a solid triangle formation so my question is why did you count it as wave 1high is 2000 and 1700 as 2 wave and why it couldn”t be wave 3 and 4 if it was a triangle.thank you sir waiting for reply

    Reply
    • Ramki on December 13, 2010 10:53 pm

      Hello Ajay, You should understand that wave analysis requires an understanding of wave personalities. Wave 3 has a tendency to be steeper, and longer than the other waves. Volume tends to increase during that phase of the trend. These characteristics are absent in the position you are seeking to label as wave 3. Hope this answers your question.

      Reply
  3. prasanta on December 19, 2010 10:47 am

    Sir,

    Your wave count in sillver is very exciting. Pl, pl, give roadmap of mcx silver as well as usdinr spotlevel for midterm.

    Thanks

    Prasanta

    Reply
  4. prasanta on December 24, 2010 11:24 am

    sir,

    your post on comex silver was on 23rd november. Pl,Pl, update it if your valuable time permit for novice trader like me.

    Thanks

    Reply
  5. prasanta on January 3, 2011 12:12 pm

    Sir,

    you have mentiomed sub B wave of 4 @31 . Now this mkt hovering around this level whole day without losing momentum. So, Pl tell how much fuel have in this counter and what will be the max ?

    Reply
    • Ramki on January 5, 2011 5:12 am

      Ajay, it is just too soon to confirm anything. Let this downmove finish. We will get a correction back up at which time one can speak with more confidence.

      Reply
  6. Jose on January 9, 2011 4:18 am

    Hi Mr. Ramki,

    I’ve just found this post you did on silver back in 23rd November. I’m really impressed with your wave count back then and silver’s move from then to today.

    You totally forseen the B wave of 4th going over the 3rd high 🙂

    Now, if we really are still in a 4th wave (I mean, haven’t done yet a 5 and are in a major correction…), at which point do you think this can go down?

    Thanks,
    Jose.

    Reply
    • Ramki on March 28, 2011 7:12 am

      Jose,
      I just noticed that although I had approved your comment, I had forgotten to come back. Anyway, you would have noticed that Wave 5 had developed nicely. About when we go down, I need to get back to my office to study the charts.

      Reply
  7. Unbeldi on January 16, 2011 11:36 am

    I think the silver wave counts are highly speculative at this point. The early onset of the extended 3 (the first 1-2 sequence) still has no end on the chart. The market does NOT show an expanding flat 3 at the top. A flat requires leg A to be a 3, but it is a 5 wave progression when you look at the details. So far we are seeing what appears as a simple sharp correction, starting with a five as it should. The future progressions at this top here will shed some clarity on the details of early assignments. There certainly are several possible scenarios. For example it is not so unusual to have an extended run up in a fifth wave if the first and the third are relatively similar, which is a possible scenario.

    Reply
  8. Ramki on January 17, 2011 1:55 am

    Hi Unbeldi, thanks for your comments. No one knows what patterns the market will trace out. Also, no one can say which count is correct until a move is finished. However, considering I posted that chart on 23rd November, it is gratifying to see that Silver has traced out a more-or-less similar path till date to what was imagined at that time.

    Reply
  9. Arvind on March 9, 2011 4:14 am

    Silver has reached and moved above your targets.
    Presently it is US$ 36OZ . Kindly post new update on Silver.
    LOOKING FORWARD FOR YOUR VALUABLE ANALYSIS

    Reply
  10. Kumar on March 28, 2011 6:48 am

    Hi sir,

    as per ur ealier views silver achieved ur TGTs, can u pls share your fresh views on silver….on which side we have to stay…buy/sell, what is the targets…pls

    Regard’s
    Kumar.

    Reply
    • Ramki on March 28, 2011 7:13 am

      Arvind & Kumar,
      I am currently on holidays and will take a look when I return in early April.

      Reply
  11. mannish garg on April 10, 2011 1:18 pm

    Sir:

    which charting software do you use?

    Mannish

    Reply
    • Ramki on April 10, 2011 8:00 pm

      Manish, There is no need for any special software to do elliott wave analysis. I use Reuters Graphics. It is nothing but a simple bar chart presentation with trendlines and fibonacci grids. These are available for free in many websites.

      Reply
  12. Yasser on April 11, 2011 8:13 am

    Mr. Ramki this is a chart that needs to be updated, as we come close to Silver ATH recorded more than 30 years ago a level that was missed by the Hunt brothers.

    regards
    Yasser

    Reply
  13. ajay on April 11, 2011 6:28 pm

    dear sir i’ve a request on silver as you mentioned on november 2010 which you leveled (3) & (4) and final wave(5) is on the move so can we say now that wave (5) is final or the correction going now is still a minor correction what’s your view on it

    Reply
    • Ramki on April 12, 2011 4:44 am

      Ajay, A move is over only when it is over! Seriously, it is too soon to say that the 5th wave is over. Be patient.

      Reply
  14. Yasser on April 13, 2011 7:09 am

    I’m happy thank you Mr. Ramki.

    Silver is no more than gold but in a much better colour. At least for me.

    Reply
  15. ramdas on April 14, 2011 4:42 am

    thanx a lot sir , for sharing your experience n experties regarding elliot wave analysis of financial markets. your analysis is simply amazing……..

    Reply
    • Ramki on April 14, 2011 5:47 am

      Ramdas, thank you

      Reply
  16. Pingback: Elliott Wave Analysis of Silver | Elliott Wave Analysis & Trading Techniques Ramki - Wave Times

  17. vivek on July 8, 2011 11:35 pm

    SIR, will you check the chart of comexsilver? i think it is all set to making of double retrcement up to $45. eagerly waiting for your inputs…..

    Reply

Leave A Reply Cancel Reply

Recent Posts
  • Has Meta (Facebook) stock seen the bottom
  • What Is The Nearest Technical Support For Meta (NASDAQ: FB)
  • Using Elliott Waves to Capture a Trade in S&P500
  • Hedge Funds and Elliott Waves – Netflix $NFLX
  • When Elliott Waves applauds the promoter’s signals!

WaveTimes is a Research Organization dedicated to providing original analysis, reports, reviews, and insights on developments in mutual funds, stocks, investing, foreign exchange, commodities, and bonds.

Contact WaveTimes

L-601 Mantri Espana,

Kariyammana Agrahara, Bellandur, Bangalore 560103

Follow Us

  • Facebook
  • YouTube
  • Twitter

© 2023 Wave Times. All Rights Reserved.
  • About
  • Books
  • Privacy Policy
  • Policies and Standards

Type above and press Enter to search. Press Esc to cancel.