We often read headlines where analysts claim that the selling is overdone in some stock. Or they could say a stock trading too high relative to its value. Can we rely solely on fundamental analysis of stock prices to base our investment and trading decisions? We will discuss this question in detail.
A fundamental analyst bases his opinions on a variety of inputs such as price-earnings ratio and recent earnings report etc. It is important to remember that he is making a judgement call based on his experience. He does not have superior information than what is known generally in the market. So, we should keep an open mind when we read such headlines. The analyst could be right, or then again, he could be wrong. We should not rely solely on what one, or even several fundamental analysts say is their opinion.
What is a sensible approach to making trading decisions?
A sensible approach will be to be aware of what points the fundamental analysts are making, but do our own independent technical analysis. If both are pointing in the same direction, then your confidence might improve.
Example that reinforces our view that we cannot rely solely on fundamental analysis.
During April2020, there was a huge oil spill in the Gulf of Mexico and BP lost over $20 billion in market capitalization in the span of just a single week. The price was at that tine around 575 pence, and the analyst was suggesting we could see it recover to around 730 pence. There was a headline in the Wall Street Journal’s Market Watch that read “Analysts say BP downturn on oil spill overdone.” (Here is a copy of this article as a pdf file in case the article gets archived!) Of course, on the day the article appeared, we had no clue what will happen in the future. So, I did my independent Elliott Wave Analysis and published it on WaveTimes.
What did Elliott Wave Analysis of BP stock price reveal?
I am quoting below the full text of the Elliott Wave Analysis of BP stock price. “I came across a report where an analyst was calling for BP to reach 730 pence from its current level of around 575.50. However, from an Elliott Wave perspective, the outlook for BP doesn’t look so rosy. I am of the view that we are headed a lot lower.
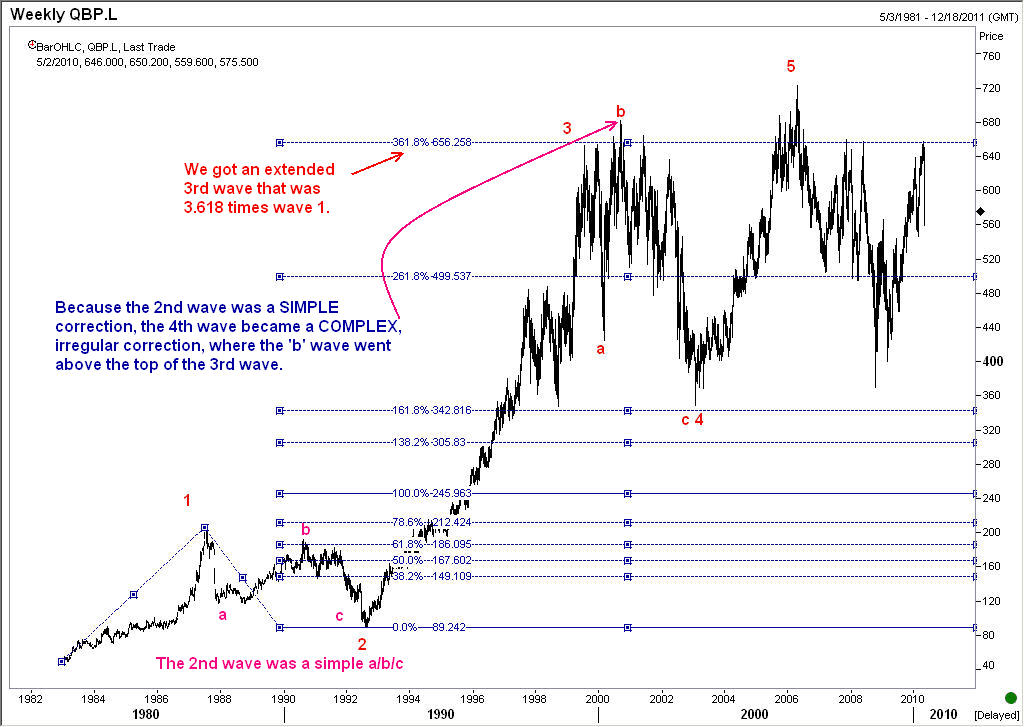
Take a look at these two charts. The first chart on BP shows that wave 3 was extended, being 3.618 times wave 1. We also see that wave 4 was an irregular correction, which follows the Elliott guideline of alternation.
Anticipating end of wave 5 and the extent of subsequent corrective move
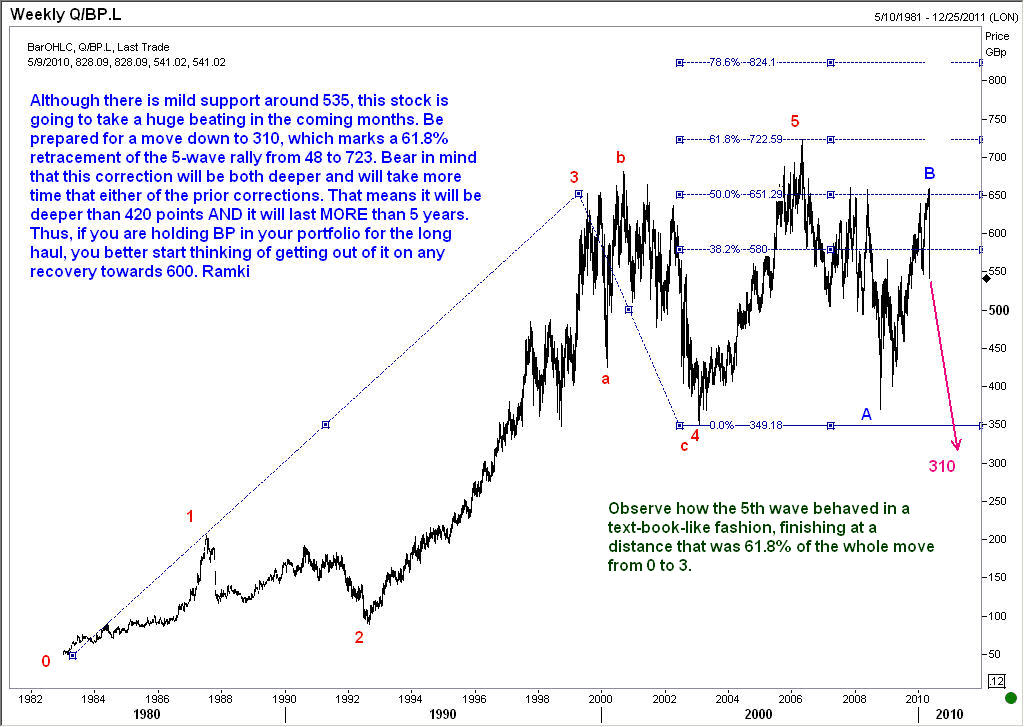
The 2nd chart confirms that the 5-wave progression was finished around 722 and so a full-blown correction was due anyway. Wave A of the anticipated 3-step correction was finished. We also got a wave B before the oil spill news hit the market. So, we have probably embarked on wave C which has targets at 310.”
You can see that I have used the method taught in my Elliott Wave book “Five Waves to Financial Freedom” to arrive at the wave 5 target. This involves computing a 61.8% measure of the distance from point zero to point three and adding it to the bottom of wave 4. As shown in the chart of BP above, wave 5 ended exactly at the target we arrived at using this method.
As for making an estimation of how deep the subsequent corrective move will travel, we look at the two prior corrections, that is, wave 2 and wave 4. We know from the Elliott Wave Theory that the upcoming correction will last longer than either of the two corrections that came before. Wave 2 lasted over 5 years which meant the correction from the top of wave 5 will also last more than that length of time. At the time of the analysis, the correction had spent only about 4 years. (The wave 5 top was posted in April 2006 and we were only in April 2010). That meant we still had at least another year to spend in a corrective mode.
Also, as wave 4 was over 410 points deep, we know that the present correction must travel more than that. Wave 5 top was at 723, and a 410-pence decline from there gives us a target of at least 313.
Where did BP stock price go after this analysis?
The stock price of BP went to a low of 296 pence as of 25 June 2010. Only after that did the stock stabilize and started moving sideways.
Conclusion
In this article we cautioned against giving too much credence to eye-catching media headlines from fundamental analysts . We urged readers to keep in mind that these analysts are merely giving their own studied opinions. They base their analysis on certain parameters like price-to-earnings ratio or recent earnings performance. We cannot rely solely on fundamental analysis of stock prices. It would be advisable for traders to do their own technical analysis and compare the possible scenarios with what the fundamental analysts are professing. Only when both are aligned in the same direction should we consider going ahead with a trade.
