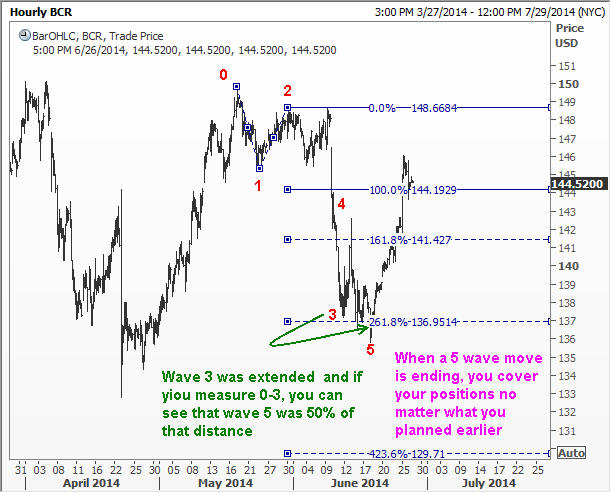
C.R.Bard, Inc designs, manufactures, packages, distributes and sell medical, surgical, diagnostic and patient care devices. Its market cap is $10.48 billion and the stock posted its 52-week high at $150.13 on April Fool’s day. Why are we looking at this stock? It is because it has the distinction of being the top loser on the S&P index yesterday! Elliot Wave analysis of C.R.Bard Inc shows some interesting patterns. As you know, Elliott Wave Principle holds that once a five wave move is completed in an upward direction, we should look out for a large move on the opposite direction. Elliott Wave analysts look for Fibonacci relationships between the various waves in order to validate their conclusions. If you take a look at the first chart below, we can see that wave 5 finished exactly at a 61.8% measure of the distance from the starting point 0 to the end of wave 3. This has been covered in detail in my Elliott Wave book “Five Waves to Financial Freedom”.

Elliott Wave Theory further holds that each of the three impulse waves that are seen in the broad five wave rally will have its own subset of five waves. You can clearly observe this phenomenon from the next Elliott Wave chart. Interestingly, you can see that not only the third wave is made up of five sub waves, but even the third wave within the third wave has its own minor five waves. Moreover, sub wave v inside the third wave finished exactly at a Fibonacci measure (50%) of the distance from 0 to iii.

The final chart shows how we can figure out some targets for the next leg of the large correction that is expected. We measure 138.2% of the distance traveled by the first move down and project that distance from the top of wave B. The target for the C wave is thus around 125.75. It is important to understand that no move will be a straight line move. However, generally speaking, C waves tend to travel fast and so anyone who is still nursing a long position is well advised to get out of that position on any recovery.

The charts and analyses posted in this blog are for educational purposes, and supplement what you learnt in my book FWTFF. I have another website, www.wavetimes.net which offers serious traders an opportunity to learn how to trade the market using my techniques.
————
27 June 2014 update.
A member asked about the internal waves of the C wave.Take a look at the chart below. We did not reach 125.75, but did manage to get to 135.80 after first recovering to 142.37. That was a decent enough move for most people. THe key point is when we have a trade, we need to watch how the market is moving. Elliott Waves is not a black box. When the minor 4th wave reached 142.37 and it started coming off, we have to get ready for the end of the move. I have explained in FWTFF how to compute these end points. One should lighten up the exposures starting from the earliest target. I use Elliott Waves to trade, not to make predictions. Sure, the target was 125.75, but if I wait indefinitely for that target to be reached even when new information is being presented, it will be an incorrect application of the wave principle. Enjoy.