• About
  • Elliott Waves
    • Elliott Waves Explained
    • Elliott Wave Magic Illustrated with Wave Charts
    • Elliott Wave Edge – How Elliott Wave Traders Win
    • Fibonacci Number Series and Elliott Waves
    • How to use Fibonacci Ratio Retracements
    • Elliott Wave Books
      • The Elliott Wave Book – Five Waves to Financial Freedom
      • Dividend Growth Investing Using Elliott Waves
    • Videos
  • Equities
    • Indices
      • Africa
        • Egypt
      • Australia
      • European Indices
        • AEX – Index, Amsterdam
        • DAX Index
        • Istanbul
        • Russia
        • Spain’s IBEX 35
      • Asian Indices
        • India
        • China
        • Dubai
        • Kuwait
        • Kuala Lumpur
        • Pakistan
        • Saudi
        • Taiwan
      • US Indices
        • S&P500
        • Nasdaq
        • Dow Jones
        • Dow Jones Utilities
    • Stocks
      • Asian Stocks
        • Indian Stocks Trading
        • Dubai Stocks Outlook
        • Japanese Stocks
        • Kuwait stocks
        • Saudi Stocks Outlook
      • African Stocks
        • Egyptian Stocks
      • Swiss Stocks
      • Australian Stocks
      • European Stocks
      • US Stocks outlook
      • UK Stocks
  • Commodities
    • Copper
    • Gasoline
    • Gold
    • Natural Gas
    • Oil
    • Palm Oil
    • Raw Sugar
    • Rubber
    • Soybean Oil
    • Silver
  • Forex
    • AUD
    • Bitcoin
    • CAD
    • CHF
    • Euro
    • GBP
    • INR
    • NZD
    • JPY
  • Raves
  • Consulting
    • Consulting
  • Ramki’s Watchlist
Top News

Has Meta (Facebook) stock seen the bottom

March 21, 2022

What Is The Nearest Technical Support For Meta (NASDAQ: FB)

February 7, 2022

Using Elliott Waves to Capture a Trade in S&P500

January 27, 2022
Facebook Twitter Instagram
WaveTimes Blog WaveTimes Blog
Wave times
  • About
  • Elliott Waves
    • Elliott Waves Explained
    • Elliott Wave Magic Illustrated with Wave Charts
    • Elliott Wave Edge – How Elliott Wave Traders Win
    • Fibonacci Number Series and Elliott Waves
    • How to use Fibonacci Ratio Retracements
    • Elliott Wave Books
      • The Elliott Wave Book – Five Waves to Financial Freedom
      • Dividend Growth Investing Using Elliott Waves
    • Videos
  • Equities
    • Indices
      • Africa
        • Egypt
      • Australia
      • European Indices
        • AEX – Index, Amsterdam
        • DAX Index
        • Istanbul
        • Russia
        • Spain’s IBEX 35
      • Asian Indices
        • India
        • China
        • Dubai
        • Kuwait
        • Kuala Lumpur
        • Pakistan
        • Saudi
        • Taiwan
      • US Indices
        • S&P500
        • Nasdaq
        • Dow Jones
        • Dow Jones Utilities
    • Stocks
      • Asian Stocks
        • Indian Stocks Trading
        • Dubai Stocks Outlook
        • Japanese Stocks
        • Kuwait stocks
        • Saudi Stocks Outlook
      • African Stocks
        • Egyptian Stocks
      • Swiss Stocks
      • Australian Stocks
      • European Stocks
      • US Stocks outlook
      • UK Stocks
  • Commodities
    • Copper
    • Gasoline
    • Gold
    • Natural Gas
    • Oil
    • Palm Oil
    • Raw Sugar
    • Rubber
    • Soybean Oil
    • Silver
  • Forex
    • AUD
    • Bitcoin
    • CAD
    • CHF
    • Euro
    • GBP
    • INR
    • NZD
    • JPY
  • Raves
  • Consulting
    • Consulting
  • Ramki’s Watchlist
WaveTimes Blog WaveTimes Blog
Home » BHP ready to dive or roar?
US Stocks outlook

BHP ready to dive or roar?

RamkiBy RamkiJanuary 11, 20172 Comments5 Mins Read
Facebook Twitter LinkedIn Telegram Pinterest Tumblr Reddit WhatsApp Email
Share
Facebook Twitter LinkedIn Pinterest Email

BHP Billiton is an Anglo-Australian multinational mining, metals and petroleum company headquartered in Melbourne, Australia. It is the world’s largest mining company measured by 2015 market values and Australia’s fourth largest company (by revenue), formerly the largest.


bhp-logo


Back in 2012, I had written an article in Forbes. At that time, the ADR was trading around $72 and I called for a 25% down move, stating there was strong resistance above $75. The actual high was posted in Feb 2013, at 76.33 and the rest is history.

Yesterday, my good friend Bob sent a chart suggesting that maybe BHP is ready to decline after posting what looks like a wave 4 top. I am taking the liberty of posting that chart here because it will help many readers to think through situations such as this.

bhp-altcount


When Bob sends me something, I look at it carefully. He is a very experienced operator.

I want you all to remember one important point. There is no wave count that is cast in stone. We should use waves to help us trade. It doesn’t matter if the wave count is wrong! With that preamble, let us take a look at the charts below to see how one could view the waves that BHP traced with a different pair of eyes.


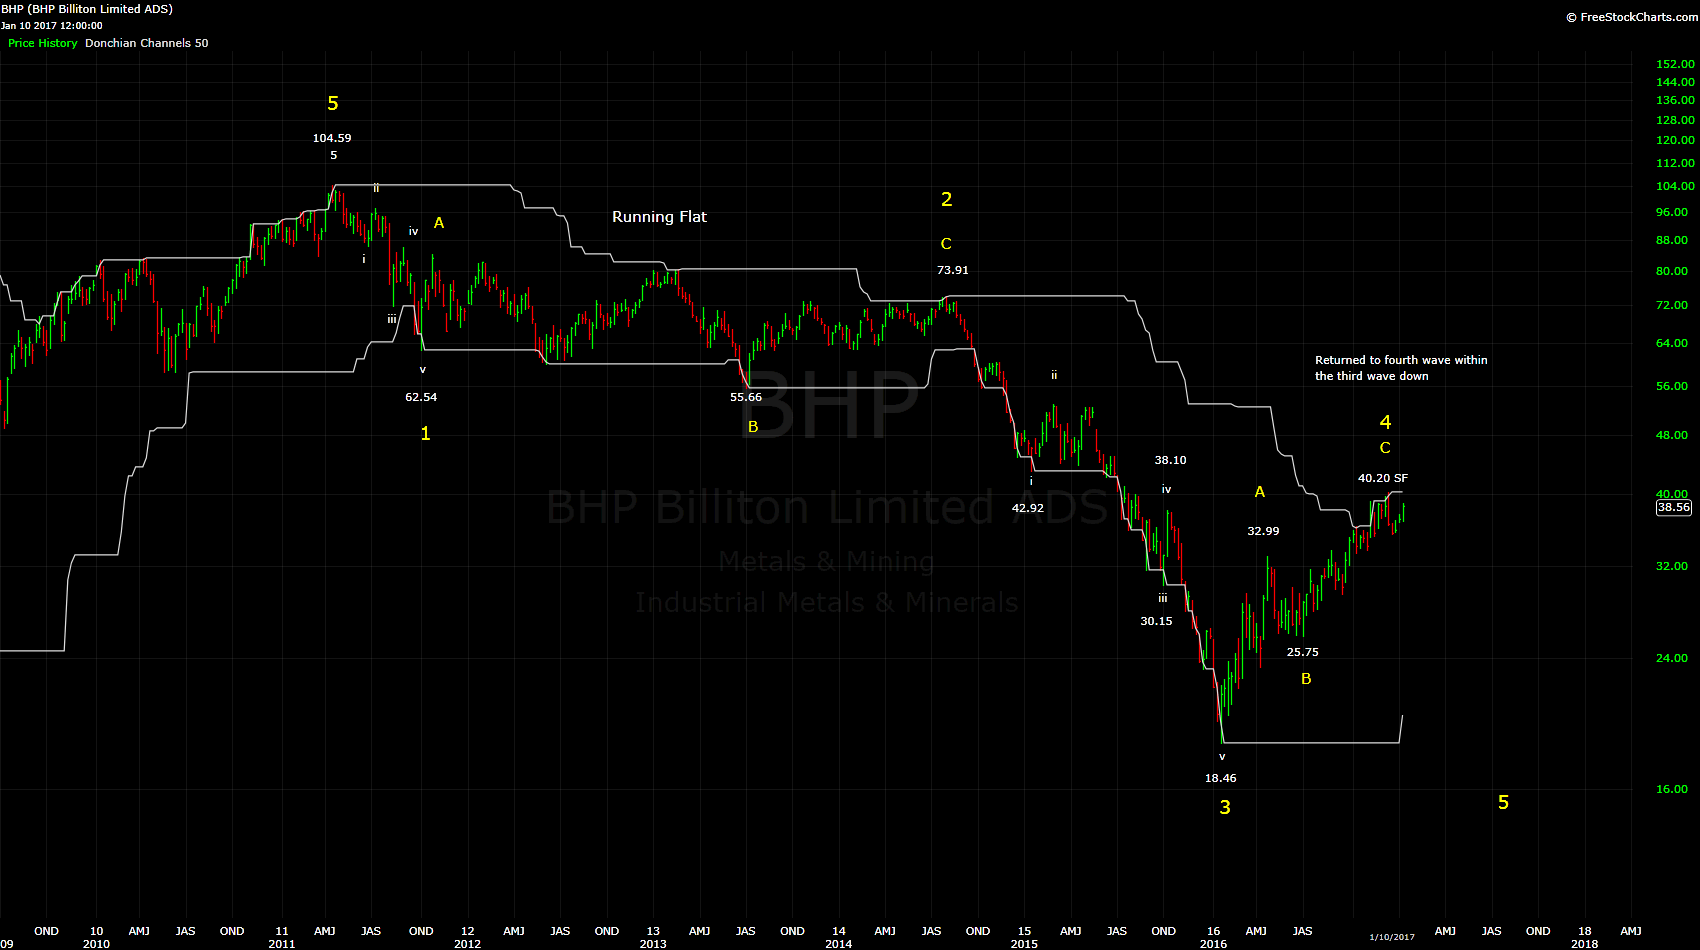
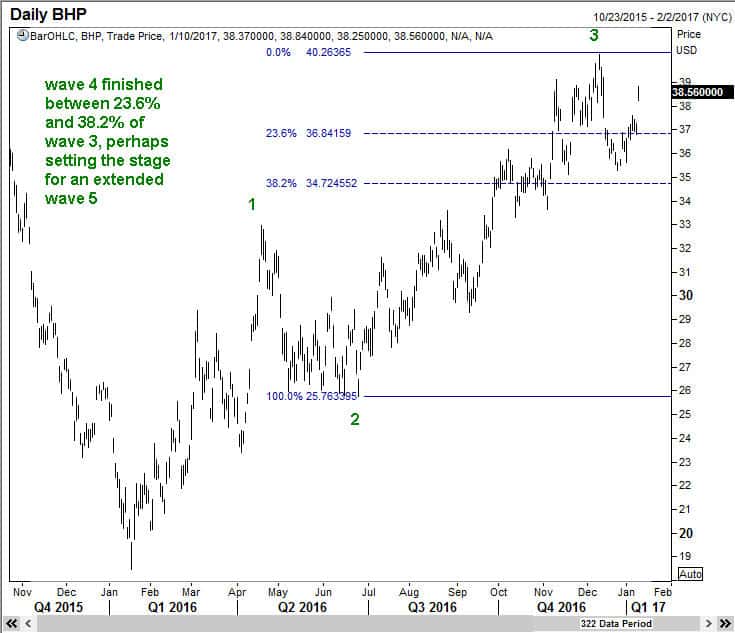
BHP – the big picture.


bhp11jan17a

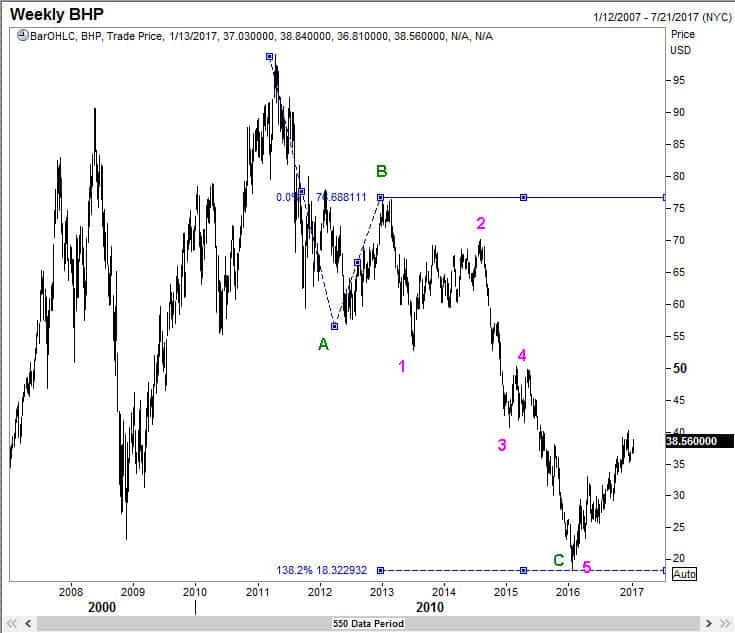
When one looks at the pink colored wave 4 inside the wave C, it will definitely appear to be a rather small pause in the middle of what could well be an extended wave 3.  So why did I call that wave 4? First, the fact that 18.32 appears to be a nice 138.2% projection target for wave C is very tempting to ignore. Second, the rally from the lows has already gone past a mini reflex point inside wave 5. Also, as wave 2 was deep, it is not normal for wave 4 to also travel so high. So I prefer to consider this rally as a new up trend (at least I get some clues to make me reconsider that view – this is discussed below).


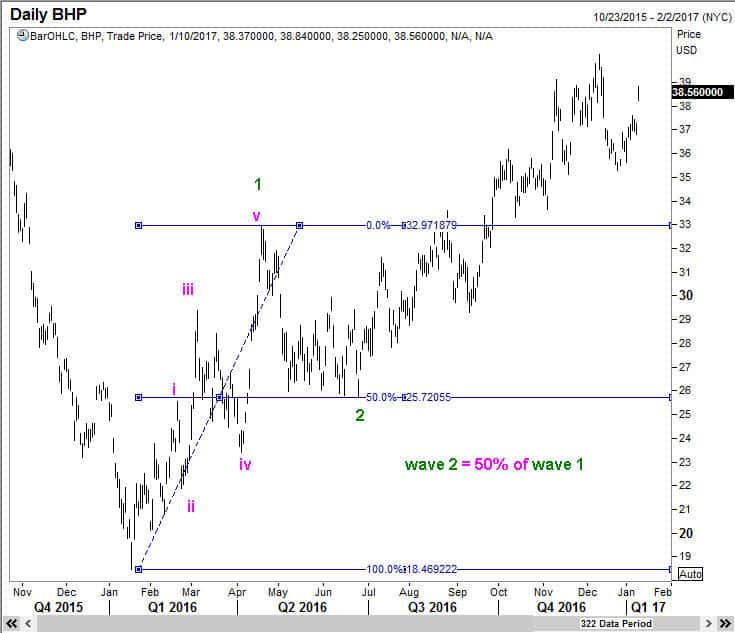
BHP Daily chart with sub waves of wave 1 shown:

Again, some might wonder if this is correct when there are so many overlaps. Take a look at sub wave 1. It has 5 minor waves. Maybe this is an expanding diagonal! Also, wave 2 came off pat to the 50% retracement level of wave 1. All very pretty (and convenient!).

bhp11jan17b


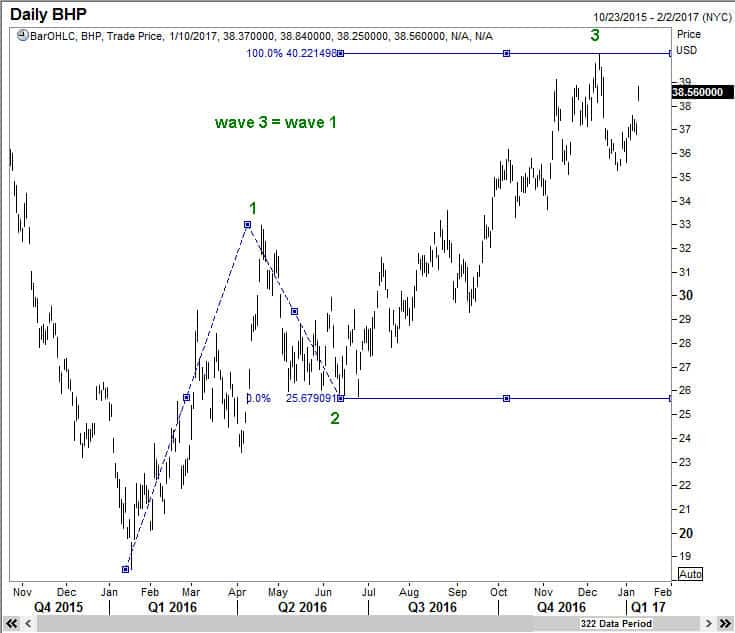
BHP has probably finished wave 3 at 40.22

The chart shown below needs no further comment, other than to recognize that maybe wave 3 of BHP has more room to go on the upside. Yet, for the moment we will let things as they are.

bhp11jan17c


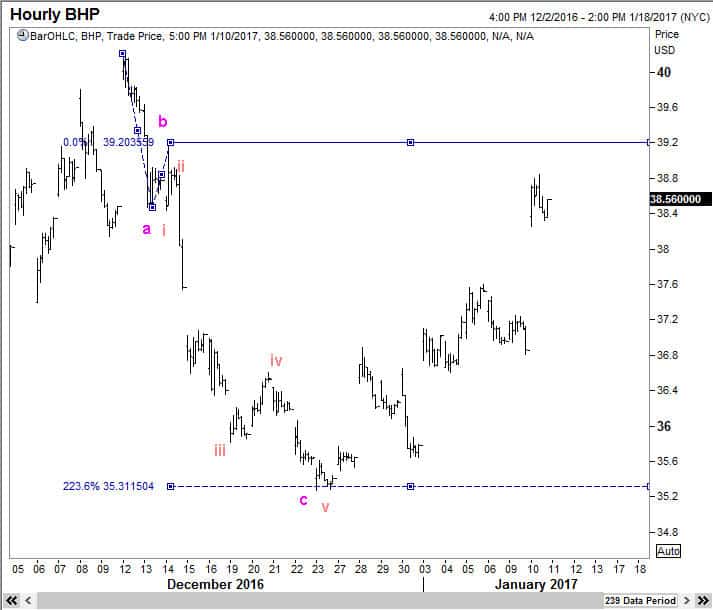
Did BHP finish wave 4 already?

Wave 2 was 50% of wave 1, and typically wave 4 should go down to at least the 38.2% level. So how dare I call this a wave 4 when you are not even able to see 3 minor waves inside wave 4!

bhp11jan17d


BHP- justifying my paradigm.  ( I always tell people that I could be wrong. So hear me again. I could be wrong…) Here are the 3 waves inside wave 4 where wave c is 223.6% of wave b. When you get some dexterity with waves, you could always justify your position. Just kidding.

bhp11jan17d1


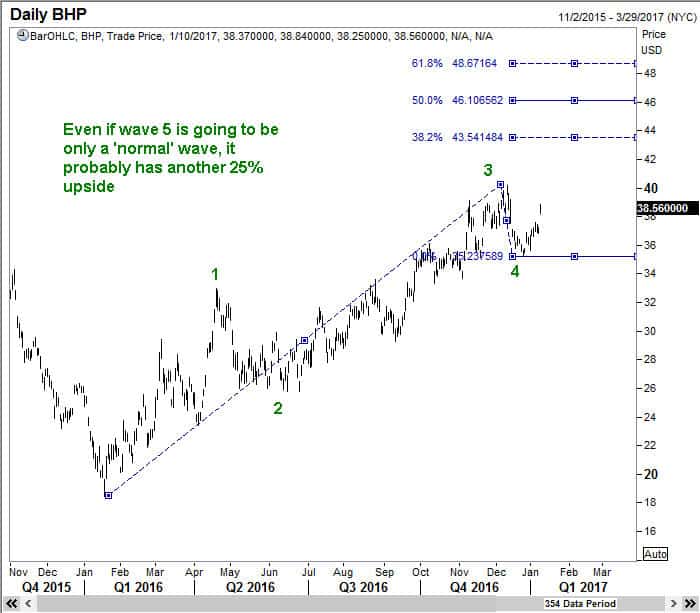
BHP on its way up, possibly as an extending wave 5

When wave 4 is abbreviated, and waves 1 and 3 are of normal measures, then there is a increased possibility that wave 5 could be an extension. You would have read that in my Elliott Wave Book Five Waves to Financial Freedom. But even as a conservative trader (investor), we can say that wave 5 will likely test 48.67 as shown below.


bhp11jan17e


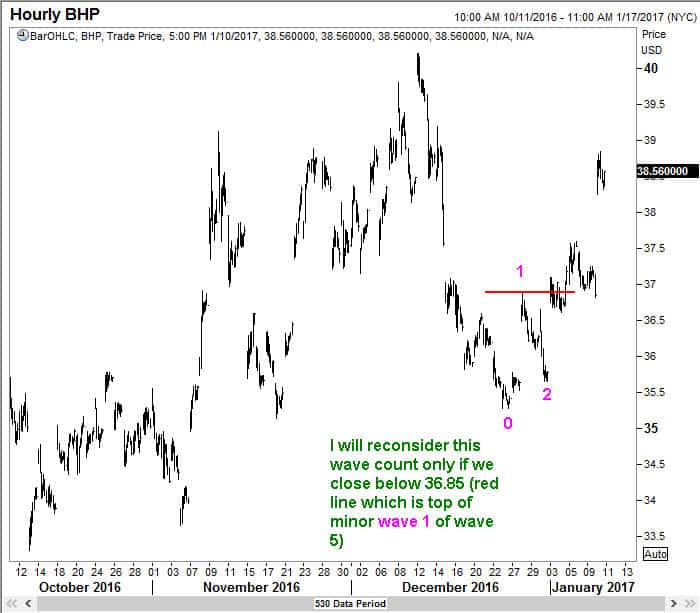
BHP – when will I start thinking ” Bob was right, again!”


bhp11jan17f

I hope you enjoyed this learning experience. After all, WaveTimes.com is the ‘living book’,  the running extension of FWTFF. One of the reviewers of that book said I haven’t shown examples of where my wave counts failed. Well, this example has the potential to fail 😉  just kidding.

By the way, please read the statutory notice below, something that I am required to post these days, now that I am registered with SEBI, which is the Indian equivalent of our SEC.

Statutory Declaration:
I am a SEBI registered Investment Advisor and a SEBI registered Research Analyst.
As you have not discussed your individual financial situation with me, you should not consider this Investment Idea as a recommendation to buy the stock. Rather it is meant to guide you how to ‘think’ about such investments. I also do not own any stock in this company and do not hold any office that will award me a compensation from that company.


BHP Billiton Elliott Wave Analysis of BHP
Share. Facebook Twitter Pinterest LinkedIn Tumblr Telegram Email
Previous ArticleRandgold Trade closed with a gain of 12%-22%
Next Article Exclusive offer to members: Analysis of a US stock that can nearly triple in value in the medium term
Ramki
  • Website

Related Posts

Has Meta (Facebook) stock seen the bottom

March 21, 2022

What Is The Nearest Technical Support For Meta (NASDAQ: FB)

February 7, 2022

Hedge Funds and Elliott Waves – Netflix $NFLX

January 17, 2022
View 2 Comments

2 Comments

  1. Manish seth on January 12, 2017 12:03 pm

    Hi Ramki terrific charts now being posted by you on regular basis.

    Having gone through your book i have been practising trading based primarily on EW view.
    Your book had a profound influence on my trading style..thanks many

    Reply
  2. Malik Imran on January 14, 2017 12:19 pm

    Easy to understand analysis!!! Very nice Sir Ramki!!!

    Before using Elliot wave I always wondered why I always bought/sold at market peaks and bottoms but Elliott wave has opened my brain and I can see logic behind every analysis!!!

    Thank You!!

    Reply

Leave A Reply Cancel Reply

Recent Posts
  • Has Meta (Facebook) stock seen the bottom
  • What Is The Nearest Technical Support For Meta (NASDAQ: FB)
  • Using Elliott Waves to Capture a Trade in S&P500
  • Hedge Funds and Elliott Waves – Netflix $NFLX
  • When Elliott Waves applauds the promoter’s signals!

WaveTimes is a Research Organization dedicated to providing original analysis, reports, reviews, and insights on developments in mutual funds, stocks, investing, foreign exchange, commodities, and bonds.

Contact WaveTimes

L-601 Mantri Espana,

Kariyammana Agrahara, Bellandur, Bangalore 560103

Follow Us

  • Facebook
  • YouTube
  • Twitter

© 2023 Wave Times. All Rights Reserved.
  • About
  • Books
  • Privacy Policy
  • Policies and Standards

Type above and press Enter to search. Press Esc to cancel.