You have seen numerous real-life examples of the application of Elliott Wave Analysis in this blog. In today’s post, I will give you another real-life example of using Elliott Waves. This is a trade that I planned and executed only a few weeks ago. So your learning will be from a recent market event.
The stock that caught my attention was Mandhana Retail Ventures Ltd, an Indian company. I spent some time capturing the steps that I went through so that I can share that example with you at a later date. As you know, this free blog exists solely to share my knowledge and experience with anyone who is interested in Elliott Waves,
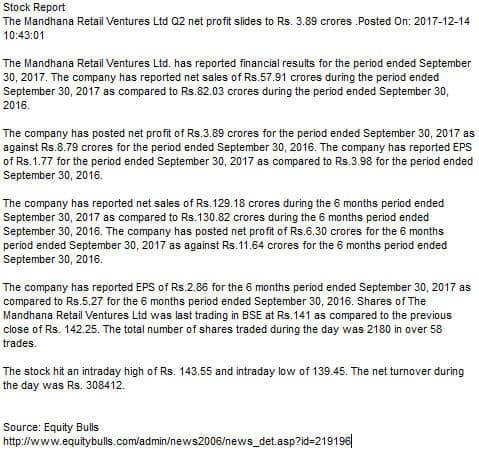
The first screenshot below gives you some fundamental news. I see no point in repeating what you can read for yourself! This report was published on 14 December. But I found it only on 20 Dec, the day I did my Elliott Wave Analysis. I wanted some comfort on the fundamental side, if possible. Clearly, that was not forthcoming. Almost every data was under performing when compared to the same period last year.
Why was I interested in this stock?
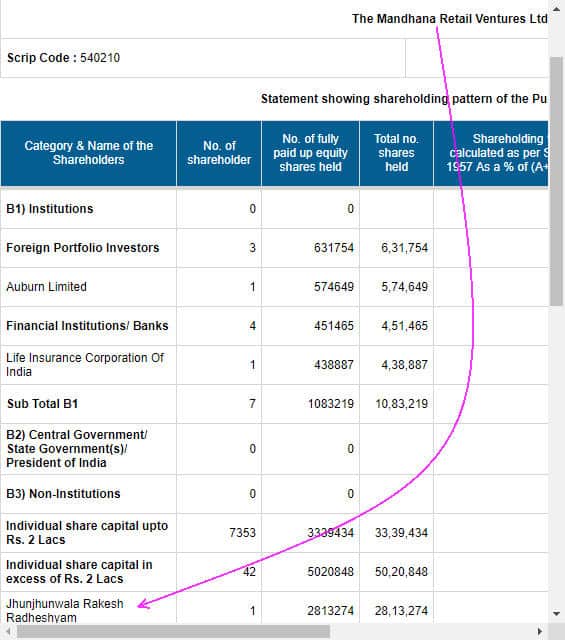
Yet, I was interested for one key reason. The Big Bull Mr Rakesh Jhunjhunwala was invested in this stock at higher than current levels! So if I could find a technical reason to buy and make some easy money, why not? What follows are several Elliott Wave charts that illustrate my thought process.
The first steps in your Elliott Wave analysis
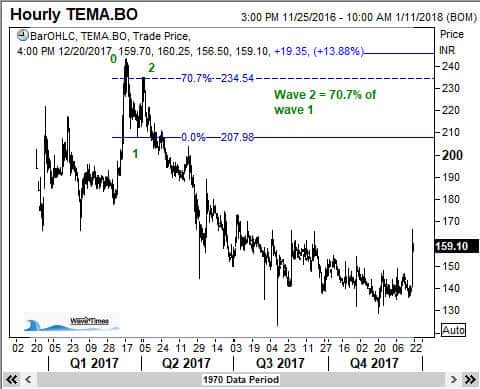
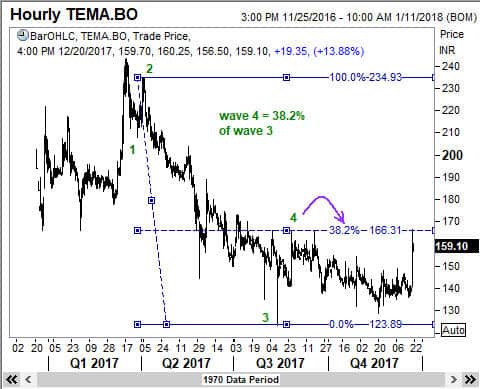
You should start your Elliott Wave analysis from a significant high. In the chart below, it was easy to spot the end of wave 1 and wave 2. Although 70.7% is not a Fibonacci ratio, it shows up quite regularly in the markets.
Where should we place the end of wave 3?
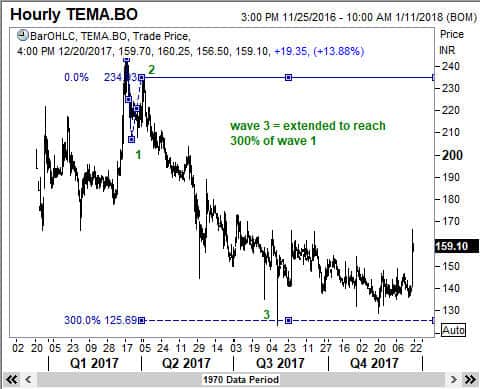
This step could be quite a challenge to many beginning Elliott Wave traders. Your main clue should be the volume and momentum. Third waves should have a personality that stands out from the first wave. This is especially so when the price is falling! So you should choose a lower point if it appears that the price continues to fall at the same speed as before any interim recovery.
The next Elliott Wave often confirms your assumptions
Having assumed that wave 3 was extended to reach 300% of wave 1, I verify that by seeing where wave 4 had finished. You can see that the fourth wave recovered to the 38.2% retracement level of wave 3, thereby confirming that the assumption I had made was more likely to be right. I frequently have to remind myself that one should never be over confident of one’s assumptions, even though we can see some additional clues. This way, we can save ourselves from being blinded by our biases.
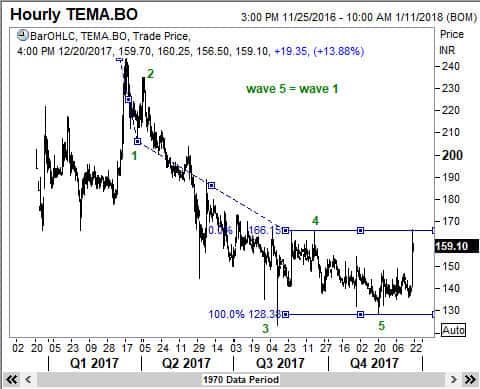
Wave 5 seems to have ended on the dot!
You might remember reading in my Elliott Wave Book “Five Waves to Financial Freedom” that the target for wave 5 can be computed with ease using several ways that has been described there. One such way is to measure the distance traveled by waves 1 and 3 and checking to see if wave 5 equals either of those. The following chart shows that this is exactly where wave 5 has ended.
Now that 5-waves have ended, what next?
The goal of any analysis should be to make money. We know that when a cycle of 5-waves is completed in one direction, a counter-trend move will happen. So the direction of the next move is clearly going to be up, and so I have to be playing this from the long side only. But the stock seems to have already moved up quite smartly from below 129 to about 166. That is a 28% move I could have had for the asking if only I had been alert enough to spot the ending pattern a few sessions ago 🙁
So now comes the question of how much more room there is left in this that I can be reasonably sure of. Of course, the stock can go directly to the moon, but am I reasonably confident of such a move? Well, I figured that answer by using the following technique. It is fairly straight forward and you can replicate the same easily with a simple calculator.
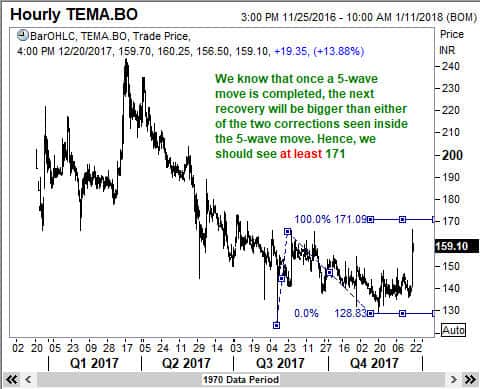
When a five-wave move is completed, the next correction will be bigger and last longer than either of the two preceding corrections. As wave 4 was deeper than wave 2, I measured 100% of the distance covered by wave 4 and added it to the bottom of wave 5. So the minimum target would be 171, and we are currently at 159 levels, leaving some 7.5% upside of which we can be reasonably confident.
Another measure I used to make up the upside potential is a Fibonacci grid as shown below.
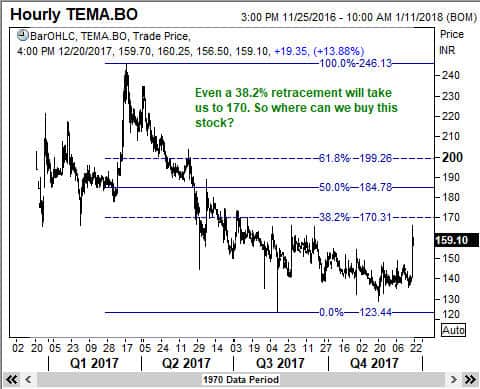
So the next key question is where should I buy the stock?
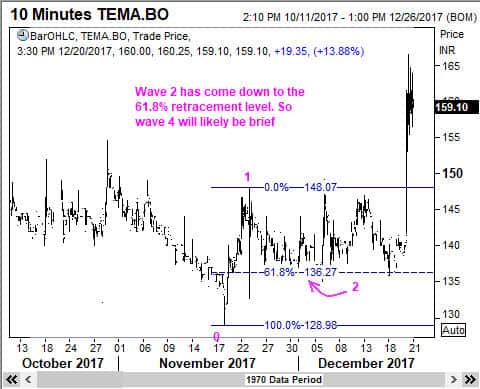
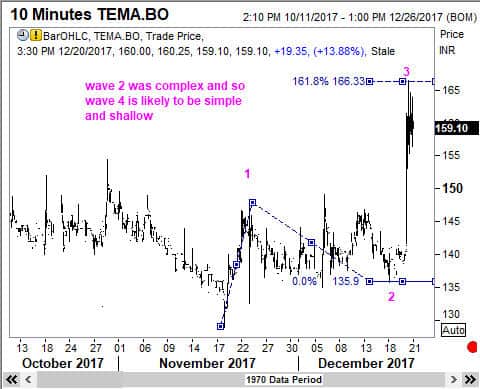
I decided that this trade is essentially going to be very short term in nature, and hence I allowed myself to look at intraday charts. Usually, if we are looking for a larger move, we should stick with the daily charts. I could clearly see that a mini third wave move has already happened, given the steepness of the rally. So how low will wave 4 come down?
Deciding where to buy
We know that fourth waves can come down to either the 38,2% or 50% retracement levels. But if I wait for the most rewarding level, I might miss a trade altogether. So I decided to buy just above the 38.2% retracement level.
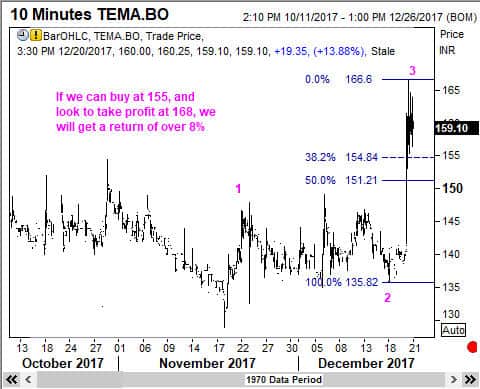
Now comes the waiting game
I have done the analysis, and my order is in the market. But the stock is in no hurry to come down quickly. Well, it decided to hurry down FURTHER after my order was eventually done! But you know as well as every other trader that this is the unwritten law of the markets. If our buy order is done, it has to go lower first, and if our sell order is done, it has to go up first!

What happened then?
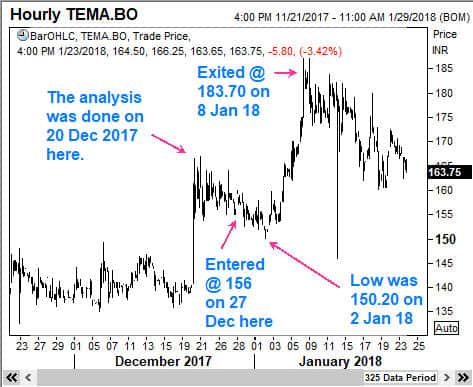
Well, the stock drifted lower and reached even below the 50% retracement, but only marginally so. It then commenced a recovery. What would most beginning traders do? They will exit at break even, or even slightly below the entry price. They just cannot bear to see a loss. They will worry that the analysis is all wrong. I too have been in such situations, and I have no shame in confessing that to you. It is normal human emotions at play. However, the winning trader usually has confidence in his work, AND a belief that Elliott Wave Theory usually delivers positive results. I managed to hold on until the stock reached above 183.50 and then got out with a neat profit. The trade lasted about 12 days, and I had made about 17%. Not a bad result at all!
What is the lesson learned here?
The lesson we learn from this real-life example of an Elliott Wave trade is we should be diligent about applying what we learned in the theory to the real markets. We should be careful about where we enter the trade so that we can have a reasonable stop loss level. We should stick with the trade while it moves towards our profit target, and when the profit target is reached, we should exit. In the above trade, the price went further up to around 187.30, but I was happy to get out near 184. We can rarely get into a trade at the very bottom, or exit at the very top.
I hope you enjoyed the above presentation and learned from it. Feel free to share it with your friends. That way, you will pay it forward. All the best.

