I am posting this trade as another example of how one can use Elliott Waves to trade sensibly and profitably.
9 Jan 2017
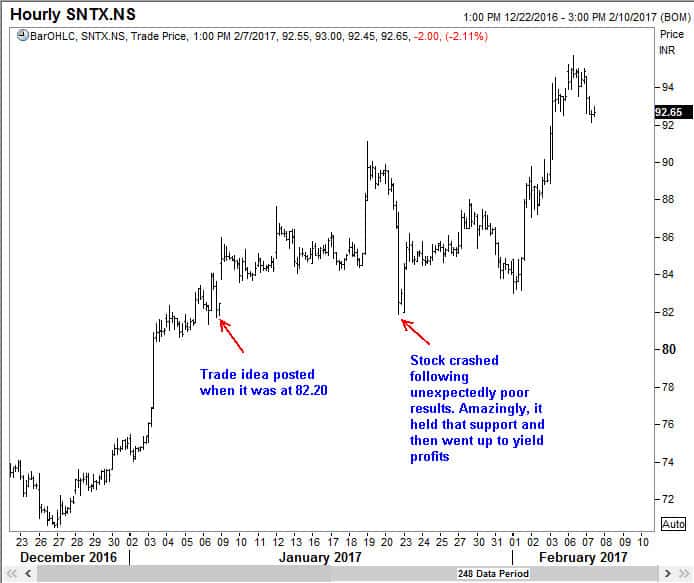
Our first trade in an Indian stock for 2017 looks at Sintex Industries Ltd. It closed in the cash market at 82.20 last Friday. I am proposing placing a bid for 25% of your position size at these levels, because, in the short term, there is a trend line resistance that needs to be overcome before we can become more comfortable. It is because of that resistance line that I am suggesting that this trade be looked at by the more aggressive traders who know the risks and are willing to take a punt for aggressive gains.
Our first trade in an Indian stock for 2017 looks at Sintex Industries Ltd. It closed in the cash market at 82.20 last Friday. I am proposing placing a bid for 25% of your position size at these levels, because, in the short term, there is a trend line resistance that needs to be overcome before we can become more comfortable. It is because of that resistance line that I am suggesting that this trade be looked at by the more aggressive traders who know the risks and are willing to take a punt for aggressive gains.
Update:
Since we have opened higher and reached a 261.8% projection target for minor wave 3, it might be better for derivatives traders to wait for a dip to around 82.50 before getting aggressive!
Since we have opened higher and reached a 261.8% projection target for minor wave 3, it might be better for derivatives traders to wait for a dip to around 82.50 before getting aggressive!
22 Jan 2017
When Sintex reported their earnings for the quarter ended Dec 2016, it shocked the market (profits were down by 39%). Quite abruptly, the stock turned and fell by 10% before recovering some ground. Did I expect this to happen? Of course not! Anyone who was long the stock at 84.60 saw his profits evaporate just like that, and now they were anxious. Others who missed buying at 84.60, waiting for the dip to 82.20 now say that the stock had fallen to a low of 81.90. Whereas they would have gladly bought it at 84.40 when the stock was trading over 90, now they are reluctant to buy even at 82.20. That is human nature.
When Sintex reported their earnings for the quarter ended Dec 2016, it shocked the market (profits were down by 39%). Quite abruptly, the stock turned and fell by 10% before recovering some ground. Did I expect this to happen? Of course not! Anyone who was long the stock at 84.60 saw his profits evaporate just like that, and now they were anxious. Others who missed buying at 84.60, waiting for the dip to 82.20 now say that the stock had fallen to a low of 81.90. Whereas they would have gladly bought it at 84.40 when the stock was trading over 90, now they are reluctant to buy even at 82.20. That is human nature.
Some others are blind followers. They had their orders at 82.20 and that has been filled. Now they are wondering what to do.
You are all experienced traders. Having these emotions is nothing new to all of us. Just recognize them as emotions. We have a method and we will follow it. I have given you 3 charts below to show how I am thinking. For the sake of being faithful to my commentary, I am considering we are long 25% at 84.60 and another 25% at 82.20. I think we can place an order to buy our third 25% at 80.70. Let us discuss next steps after seeing what happens tomorrow.
You are all experienced traders. Having these emotions is nothing new to all of us. Just recognize them as emotions. We have a method and we will follow it. I have given you 3 charts below to show how I am thinking. For the sake of being faithful to my commentary, I am considering we are long 25% at 84.60 and another 25% at 82.20. I think we can place an order to buy our third 25% at 80.70. Let us discuss next steps after seeing what happens tomorrow.
27 Jan 2017
Hello members,
We have been on this trade from 9 Jan and it is almost 3 weeks. The price has been to above Rs. 91 and then rapidly came down to a low of 81.90. Since then, we have been struggling to overcome 86.20-25 levels. I am sure that once we get past that resistance, the stock can retest the 91 level again. However, I am keen to move on. Thus, I would like to call this trade as closed. If any of you have an objection to that, please let me know.
I just checked the live price as I am writing and the stock is trading at 87.20, giving us almost a 5% profit even from the relatively adverse levels at which I am assuming you purchased.
Onwards we go then for new trades .
————————————————————————————————————————————————————————
And yesterday, 6 February, 2017 Sintex reached a high of Rs.95.70
So if you had purchased it at 82.20, which was the recommended level, it is a gain of over 15% in just a few short weeks.
Of course, I had sent the members over a dozen charts, but I am posting just one here.