Elliott Wave analysis works on all time frames. Here is an example of how I used the daily, hourly and 30-minute charts of the EURUSD to recommend a trading strategy to several of my clients back in September 2017. Why am I talking about that now? It is because the headlines I read just now in Reuters says the currency pair has a year-to-date low versus the US Dollar today. If you are involved in the FX markets, and in reasonable size, you might wish to consider discussing your position with me. However, the goal of this post is to showcase how I approach the markets. This forms part of this free blog being a ‘living book’, an extension to “Five Waves to Financial Freedom“.
You may download the full report that I sent out to my clients in September 2017 from this link: Elliott Wave Analysis of EURUSD 26 Sep 2017.
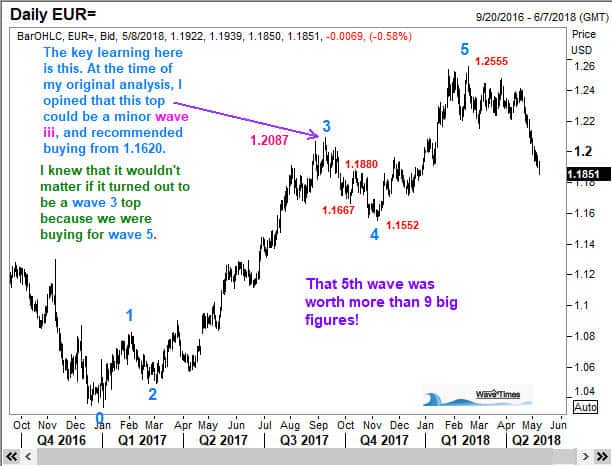
The following chart shows you how it turned out.