• About
  • Elliott Waves
    • Elliott Waves Explained
    • Elliott Wave Magic Illustrated with Wave Charts
    • Elliott Wave Edge – How Elliott Wave Traders Win
    • Fibonacci Number Series and Elliott Waves
    • How to use Fibonacci Ratio Retracements
    • Elliott Wave Books
      • The Elliott Wave Book – Five Waves to Financial Freedom
      • Dividend Growth Investing Using Elliott Waves
    • Videos
  • Equities
    • Indices
      • Africa
        • Egypt
      • Australia
      • European Indices
        • AEX – Index, Amsterdam
        • DAX Index
        • Istanbul
        • Russia
        • Spain’s IBEX 35
      • Asian Indices
        • India
        • China
        • Dubai
        • Kuwait
        • Kuala Lumpur
        • Pakistan
        • Saudi
        • Taiwan
      • US Indices
        • S&P500
        • Nasdaq
        • Dow Jones
        • Dow Jones Utilities
    • Stocks
      • Asian Stocks
        • Indian Stocks Trading
        • Dubai Stocks Outlook
        • Japanese Stocks
        • Kuwait stocks
        • Saudi Stocks Outlook
      • African Stocks
        • Egyptian Stocks
      • Swiss Stocks
      • Australian Stocks
      • European Stocks
      • US Stocks outlook
      • UK Stocks
  • Commodities
    • Copper
    • Gasoline
    • Gold
    • Natural Gas
    • Oil
    • Palm Oil
    • Raw Sugar
    • Rubber
    • Soybean Oil
    • Silver
  • Forex
    • AUD
    • Bitcoin
    • CAD
    • CHF
    • Euro
    • GBP
    • INR
    • NZD
    • JPY
  • Raves
  • Consulting
    • Consulting
  • Ramki’s Watchlist
Top News

Has Meta (Facebook) stock seen the bottom

March 21, 2022

What Is The Nearest Technical Support For Meta (NASDAQ: FB)

February 7, 2022

Using Elliott Waves to Capture a Trade in S&P500

January 27, 2022
Facebook Twitter Instagram
WaveTimes Blog WaveTimes Blog
Wave times
  • About
  • Elliott Waves
    • Elliott Waves Explained
    • Elliott Wave Magic Illustrated with Wave Charts
    • Elliott Wave Edge – How Elliott Wave Traders Win
    • Fibonacci Number Series and Elliott Waves
    • How to use Fibonacci Ratio Retracements
    • Elliott Wave Books
      • The Elliott Wave Book – Five Waves to Financial Freedom
      • Dividend Growth Investing Using Elliott Waves
    • Videos
  • Equities
    • Indices
      • Africa
        • Egypt
      • Australia
      • European Indices
        • AEX – Index, Amsterdam
        • DAX Index
        • Istanbul
        • Russia
        • Spain’s IBEX 35
      • Asian Indices
        • India
        • China
        • Dubai
        • Kuwait
        • Kuala Lumpur
        • Pakistan
        • Saudi
        • Taiwan
      • US Indices
        • S&P500
        • Nasdaq
        • Dow Jones
        • Dow Jones Utilities
    • Stocks
      • Asian Stocks
        • Indian Stocks Trading
        • Dubai Stocks Outlook
        • Japanese Stocks
        • Kuwait stocks
        • Saudi Stocks Outlook
      • African Stocks
        • Egyptian Stocks
      • Swiss Stocks
      • Australian Stocks
      • European Stocks
      • US Stocks outlook
      • UK Stocks
  • Commodities
    • Copper
    • Gasoline
    • Gold
    • Natural Gas
    • Oil
    • Palm Oil
    • Raw Sugar
    • Rubber
    • Soybean Oil
    • Silver
  • Forex
    • AUD
    • Bitcoin
    • CAD
    • CHF
    • Euro
    • GBP
    • INR
    • NZD
    • JPY
  • Raves
  • Consulting
    • Consulting
  • Ramki’s Watchlist
WaveTimes Blog WaveTimes Blog
Home » Additional Chart of EURUSD
Euro

Additional Chart of EURUSD

RamkiBy RamkiSeptember 12, 20119 Comments1 Min Read
Facebook Twitter LinkedIn Telegram Pinterest Tumblr Reddit WhatsApp Email
Share
Facebook Twitter LinkedIn Pinterest Email

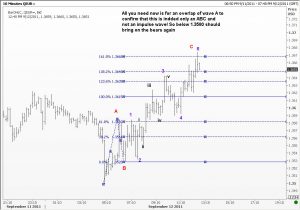
NOw that we have actually reached 1.3670, you need to know when it is confirmed that the move is over. We don’t want a scenario where because of the extended 5th wave seen in the last chart that we get a quick rally back to 1.3840, do we? Alternately, there is the tendency of corrections to go back to prior fourth wave level, which lies at 1.3725. So when exactly should we become bearish again?
See the chart.

EUR/USD Euro Ramki
Share. Facebook Twitter Pinterest LinkedIn Tumblr Telegram Email
Previous ArticleEURUSD update
Next Article EURUSD chart revisited
Ramki
  • Website

Related Posts

How we traded EURJPY recently

October 23, 2019

An example of EURUSD analysis using Elliott Waves

May 8, 2018

What WaveTimes could do for you in EURUSD

May 8, 2017
View 9 Comments

9 Comments

  1. tom on September 13, 2011 9:23 pm

    Dear Mr Ramki, could you besides all the rest of the counters, also update the latest wave count,for Crude palm oil and soyoil market ?

    Reply
  2. Ondas Elliot on September 14, 2011 2:35 pm

    Hi,
    In your analysis you have to take corrective waves less time than the impulsive waves of the same grade, you do not think this is a logical error?

    Reply
    • Ramki on September 14, 2011 8:00 pm

      Hi Ondas, corrections tend to “balance” the progression. If the impulse traveled too quickly, the correction will likely be laborious.

      Reply
  3. Hitesh on September 16, 2011 6:21 am

    A question always hit my head is: “How a Elliott Wave Trader is identifying the Wave C under the ZigZag and Wave 3 of Impluse move?” As the fact that, under the ZigZag, 1. Wave A will be five wave and same can be applied to Wave 1 of impluse move
    2. Wave B would be the three wave pattern and most likely travel to 50% to 76%, same can be applied to Wave 2 of impluse wave.
    3. Wave C would be the five wave and same can be applied to the wave 3

    So if I want to take most out of wave principal, how I will be sure that I am in wave 3 and not in wave C?

    Reply
    • Ramki on September 16, 2011 9:52 pm

      Hitesh, gd question. It depends on your count of the waves that preceded the (possible) zigzag. As we have to always bear in mind that our prior waves’ count could be wrong, we should be ever ready to change our ongoing count. Usually, it is not important whether u are in wave C or wave 3. What matters is you are positioned in the right direction

      Reply
  4. Hitesh on September 16, 2011 9:10 am

    Hello Ramki,
    Can you post your view of the count re:Eur/Usd having reached 1.3936 yesterday.

    Thank you,

    Hitesh

    Reply
  5. RainMaker on September 16, 2011 8:19 pm

    Ramki sir, great analysis as always. I have a question hope you will be kind enough to guide.

    Once the price moves below 1.3580 i.e below point A it brings on the bears. When to enter short trade and what should be the SL ?

    Reply
    • Ramki on September 18, 2011 12:39 am

      Rainmaker, the wave counts have changed as is evident from my recent update. Also, this blog serves to guide your thinking, and not to give trade recommednations!

      Reply
      • RainMaker on September 18, 2011 2:19 am

        Ramki Sir,

        Thanks for response, to get a recommendation was not the idea, what I really wanted to learn was how to trade the given view (bearish) should the move happens.

        Reply

Leave A Reply Cancel Reply

Recent Posts
  • Has Meta (Facebook) stock seen the bottom
  • What Is The Nearest Technical Support For Meta (NASDAQ: FB)
  • Using Elliott Waves to Capture a Trade in S&P500
  • Hedge Funds and Elliott Waves – Netflix $NFLX
  • When Elliott Waves applauds the promoter’s signals!

WaveTimes is a Research Organization dedicated to providing original analysis, reports, reviews, and insights on developments in mutual funds, stocks, investing, foreign exchange, commodities, and bonds.

Contact WaveTimes

L-601 Mantri Espana,

Kariyammana Agrahara, Bellandur, Bangalore 560103

Follow Us

  • Facebook
  • YouTube
  • Twitter

© 2023 Wave Times. All Rights Reserved.
  • About
  • Books
  • Privacy Policy
  • Policies and Standards

Type above and press Enter to search. Press Esc to cancel.