Happy New Year to all readers of WaveTimes!
In order to be successful, you should spend a lot of time looking for the right candidates. Unfortunately, most traders spend a lot of time in the market, buying and selling stocks with very little to show in profits. Given the Elliott Wave edge that you now possess, your success rate will be much higher if you prepare a watch list of candidates that look interesting and move in when the risk-reward is to your liking. If you are already a student of my online program, you will be familiar with how I approach each candidate. Little surprise then that more than 90% of the trades that has been discussed in the course have yielded such splendid returns.
Today, I am presenting a set of charts that my old pal, Bob D brought to my notice. He is one of the first students of the course. Bob, still waiting for your video testimonial! Anyway, take a look at the following.
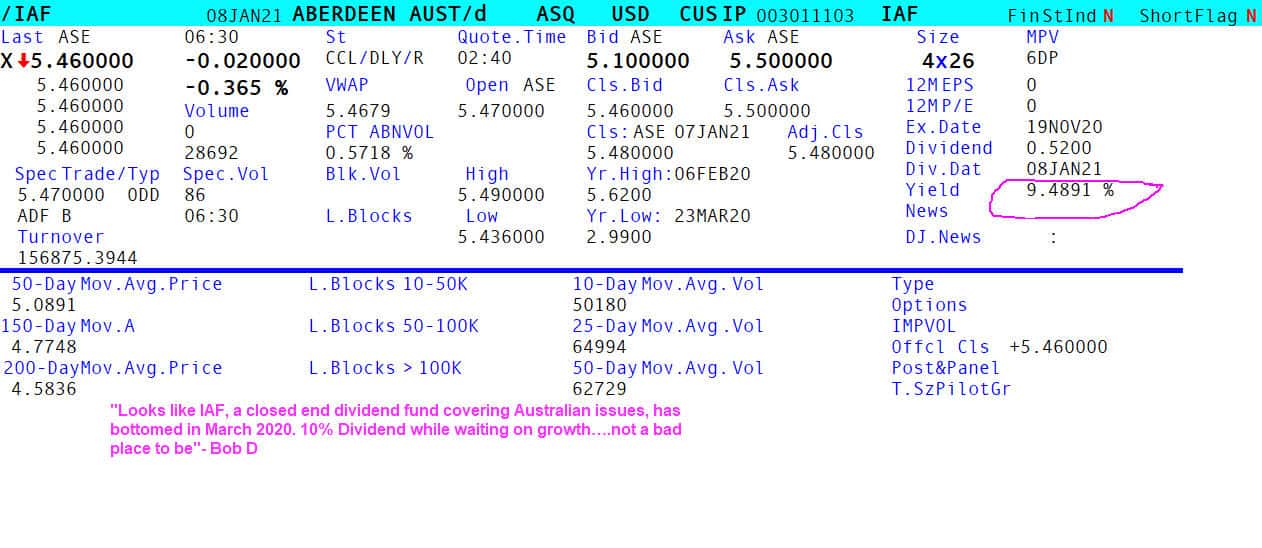
Aberdeen Australia Equity Fund is in a bull run now. This first image below gives an overview of the Fund. Observe that its dividend yield is currently well above 9%
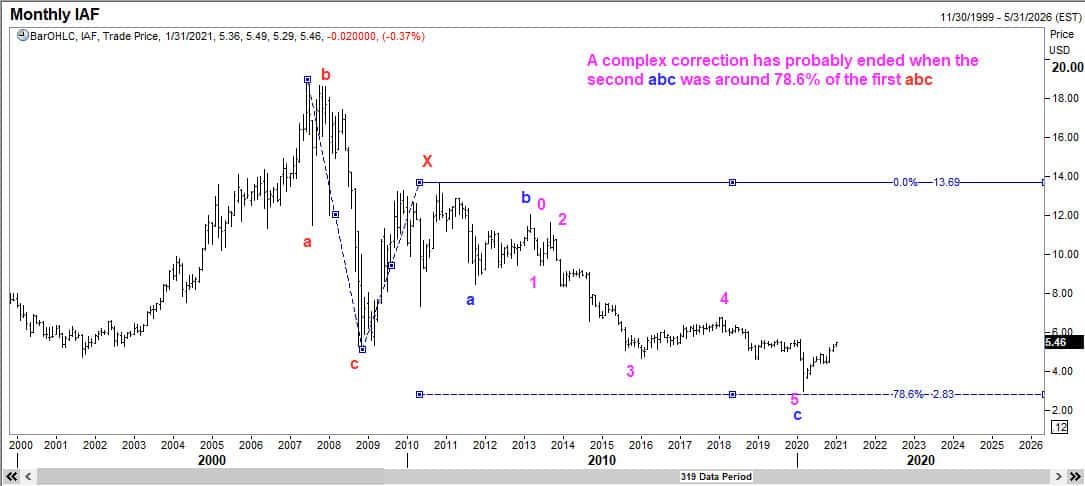
Now let us start our Elliott Wave analysis of Aberdeen Australia Equity Fund. As always, I recommend that you commence your analysis with a long-term chart such as this one.
Aberdeen Australia has likely completed a complex correction in the form of a double three. Notice that the second set of abc has ended near the 78.6% measure of the first abc.
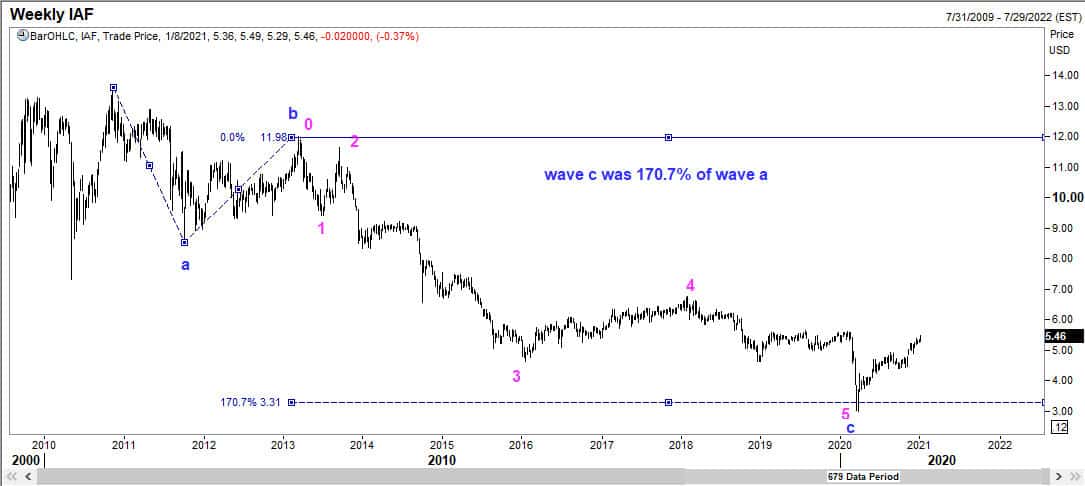
Next we shall examine the weekly chart where I show you that the second wave c was 170.7% of the second wave a.
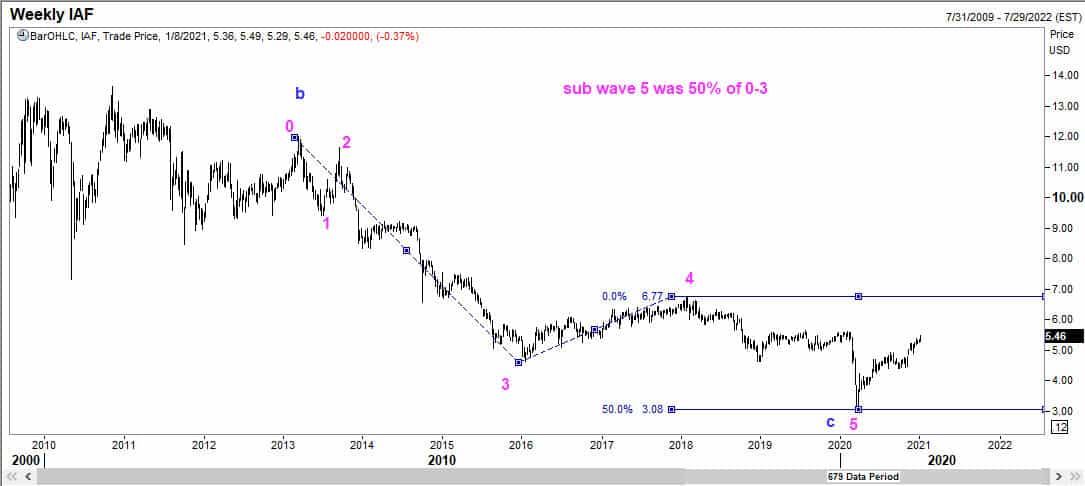
Next, I am showing you how we can gain confidence that all 5 waves are probably over in wave C. I figure out that sub wave 5 ended at 50% measure of 0-3. You should be familiar with this approach from my Elliott Wave book, Five Waves To Financial Freedom.
Next, if you examine sub wave 5 in detail, you can see that minor wave v was extended to be 123.6% of 0-3. And we know what happens when an ending wave 5 is extended! We get a swift reversal.

Next we will consider whether there are any opportunities for us nearby. For this, we will look at the moves from the lows seen in March 2020. (The pandemic panic low)

Observe that we are in wave 5 of the move up. There are two nearby targets, but while we stay above 5.15, we could even get an extended 5th wave to around 6.30. As the nearest target is so close, we can’t risk buying too soon. Remember, there is no point is exhibiting bravado when it comes to risking money in the markets. So, while we do recognize the possibility of an extended wave 5 towards 6.30, we won’t get a 3-to-1 reward to risk if we buy at 5.40 with a 25 cent stop in the event the price falters at 5.75.
That leaves us with having to put this ticker in a watchlist, and get alerted if we dip to around 4.50, or rally to 6.20. If we reach 6.20, we should look for a swift correction down. If we come down to 4.40 first, we can evaluate whether wave 2 of the new bull cycle is ending there and take action.
Thus, you have your first example for 2021. This blog continues to remain a living book, an extension of Five Waves to Financial Freedom. Good luck to all readers in the new year.
If you haven’t enrolled in my hugely popular online Elliott Wave course, head over to there without further delay. The year in young, and the opportunities abound. Learn how you can transform your trading results, starting today!
